Previous | Close
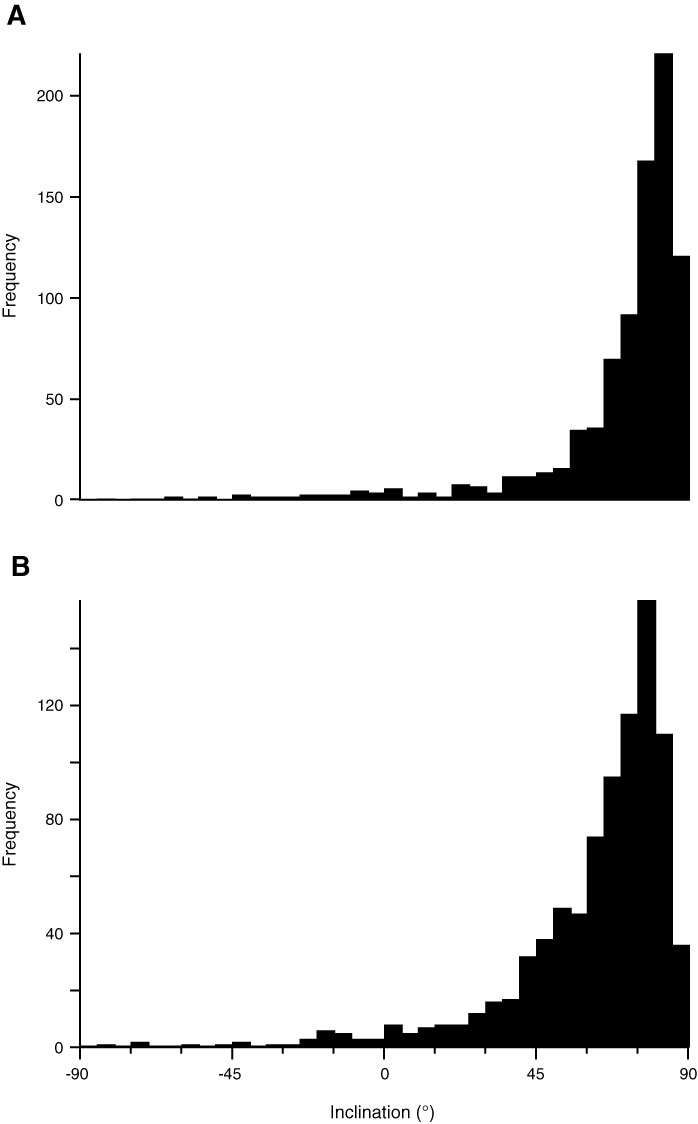
Figure F118. Histogram of inclination for (A) NRM and (B) 20 mT.
Previous | Close | Top of page