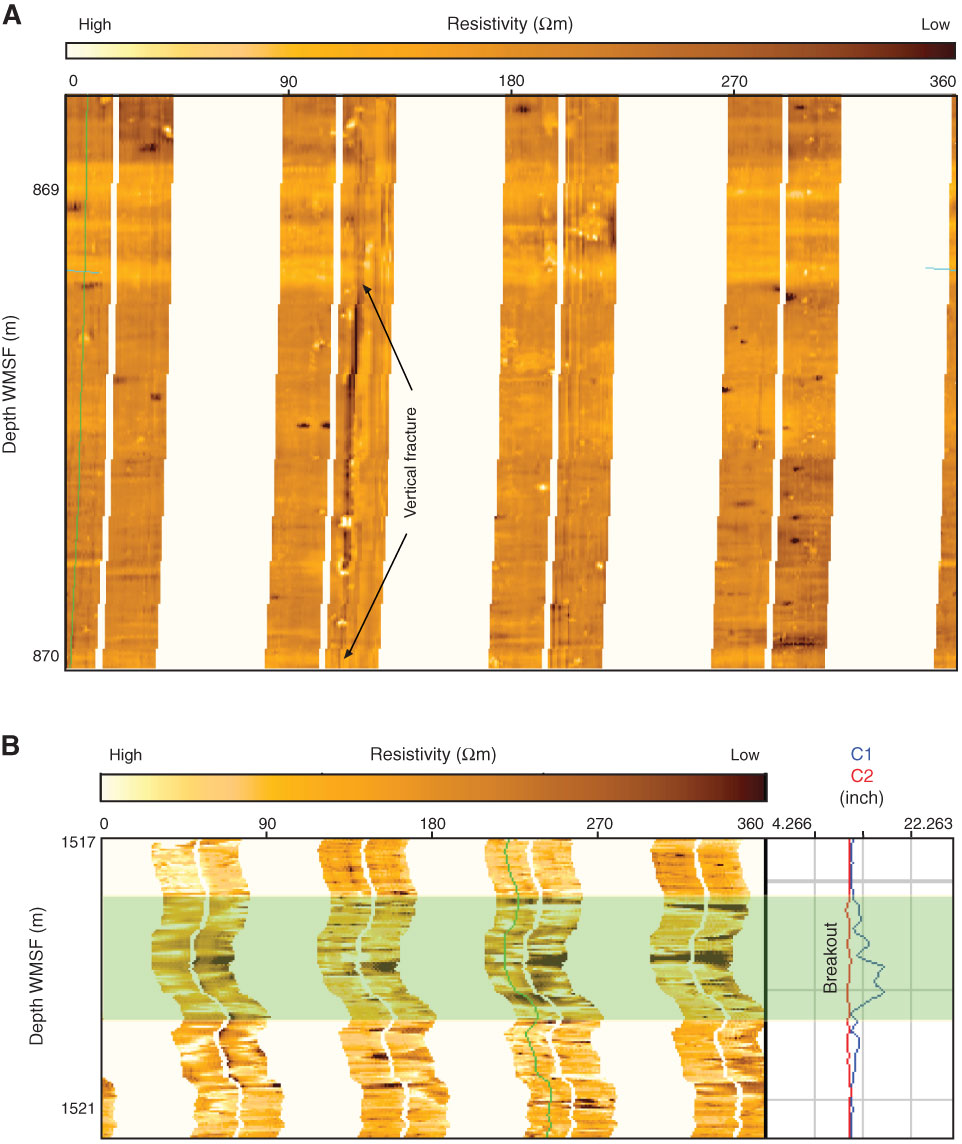
Figure F39. A. Example of vertical fracture in FMI data that is apparently normal to core. Fracture may represent DITF. B. Example of breakout as defined by Caliper 1 (C1) > Caliper 2 (C2) (right column). In left column note that low-resistivity signal is not localized on either pad pair, preventing accurate mapping of breakouts from FMI data.
Previous | Close | Next | Top of page