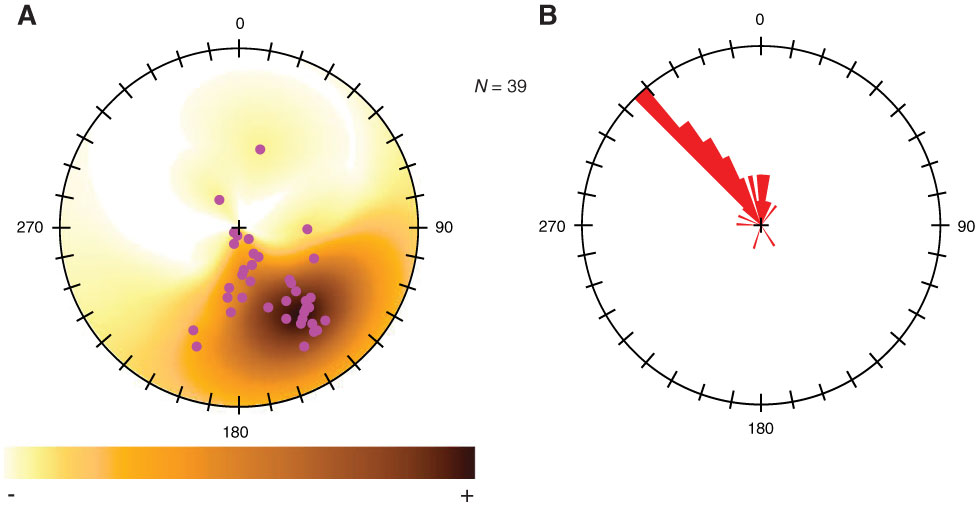
Figure F42. FMI data of fault attitudes from 897 to 1644 m WMSF (see also C0009_T6.XLS in STRUCGEOL in "Supplementary material"). A. Contour stereonet plot of poles to fault planes. B. Rose diagram of dip directions for all faulting attitudes. Faults dip moderately to shallowly to the northwest.

Previous | Close | Next | Top of page