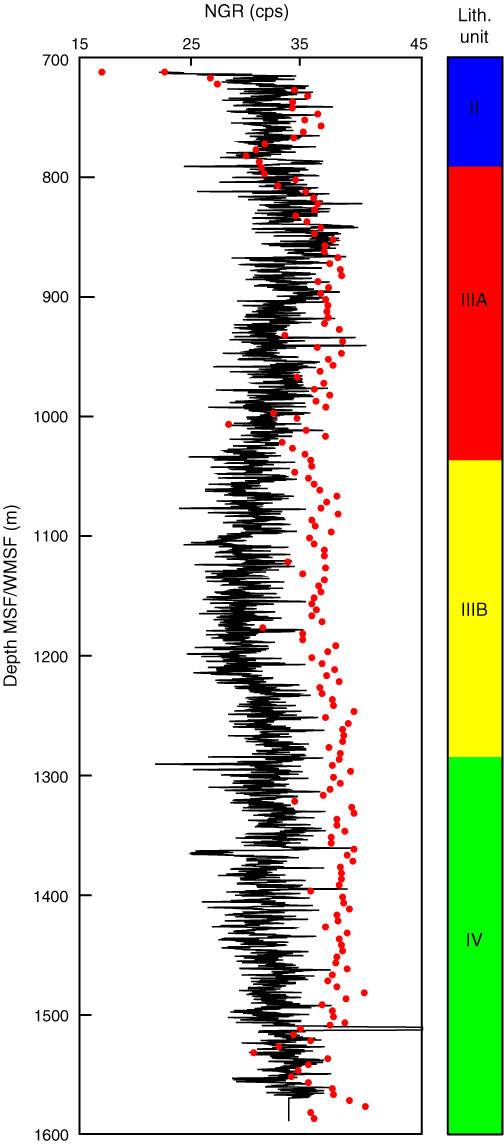
Figure F66. Natural gamma ray (NGR) measured by MSCL in cuttings (red dots; depths in MSF), shown with downhole logging data (black line; depths in WMSF). Logging data are converted to counts per second (cps) for comparison with MSCL-W data using a relationship derived for terrigenous sediments: NGR (cps) = (NGR [gAPI]) – 12)/2.12 (Mountain et al., 1994).
Previous | Close | Next | Top of page