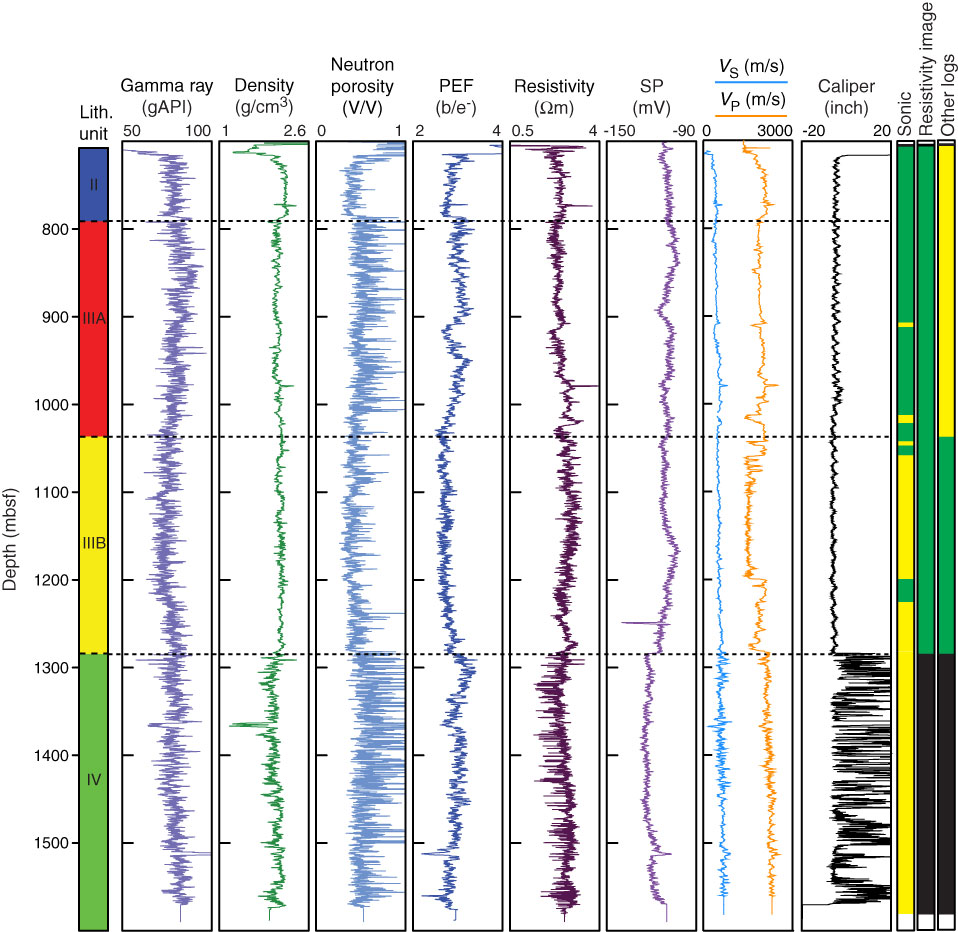
Figure F7. Composite wireline logs collected from logging Runs 1 and 2 (Drilling Phases 5 and 6; see Table T1 for Hole C0009A and their data quality indicators). From left to right: lithologic units, gamma ray, density, neutron porosity, photoelectric effect (PEF), resistivity, spontaneous potential (SP), P- and S-wave velocity, calipers, and data quality indicators for sonic velocity, resistivity images, and other logs except neutron porosity. Data quality: green = good, yellow = moderate, black = poor.
Previous | Close | Next | Top of page