Previous | Close | Next
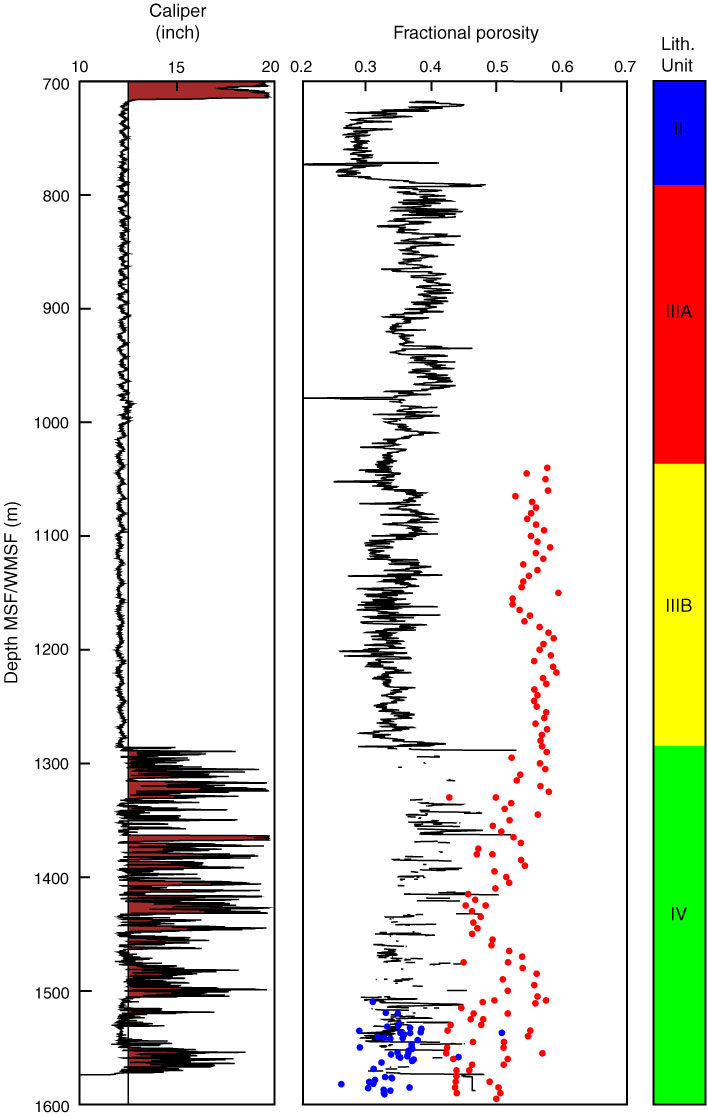
Figure F71. Filtered density-derived porosity log (black line; for calipers <12.5 inches) compared with MAD porosity measured on cores (blue dots) and cuttings (red dots).
Previous | Close | Next | Top of page