Previous | Close | Next
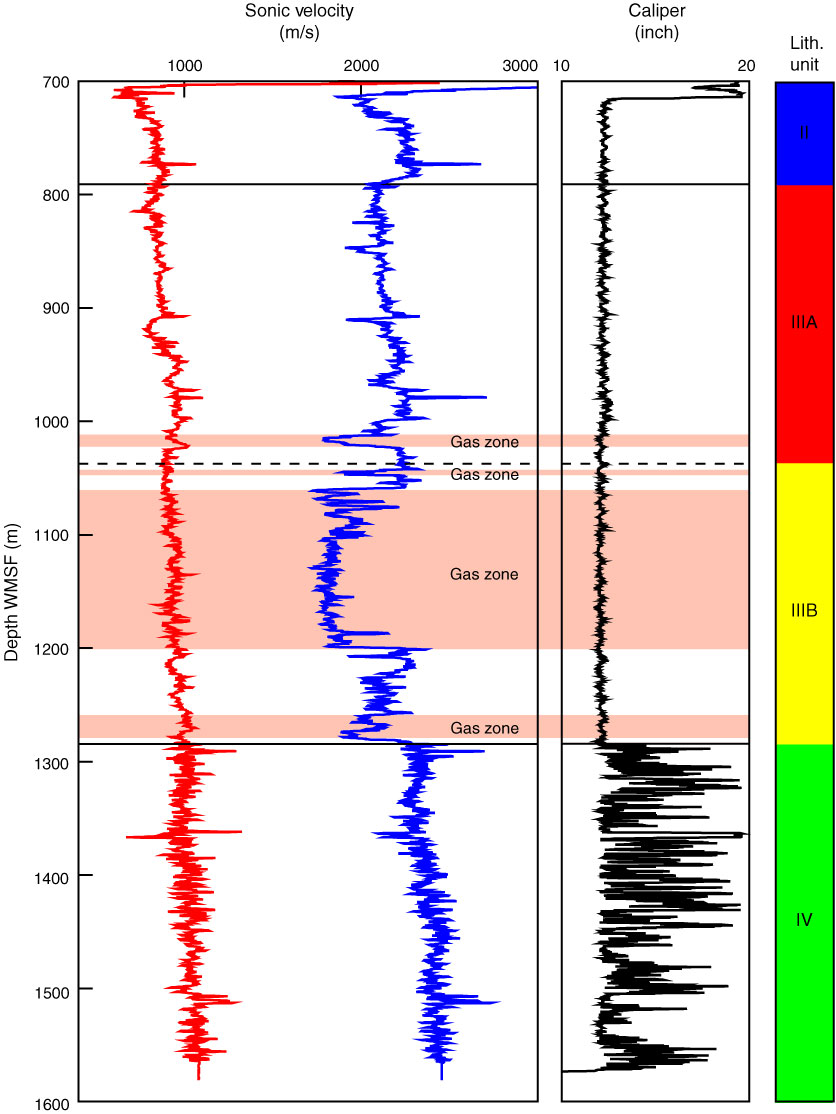
Figure F75. P-wave (blue) and S-wave (red) velocity. Drops in P-wave velocity suggest gas-enriched zones.
Previous | Close | Next | Top of page