Previous | Close | Next
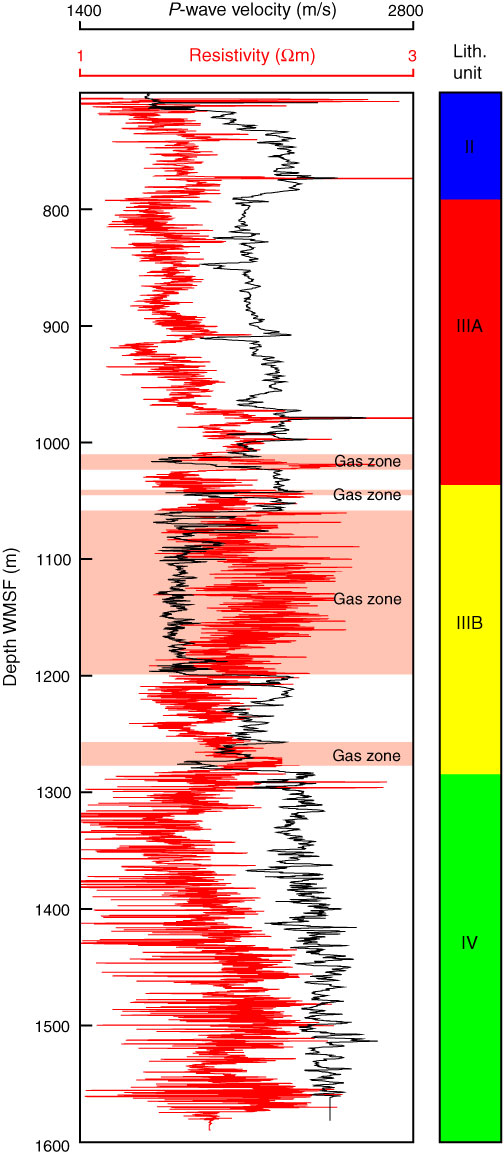
Figure F77. Resistivity and P-wave velocity depth profiles. Note increases in resistivity coincident with decreases in velocity suggesting gas-rich zones.
Previous | Close | Next | Top of page