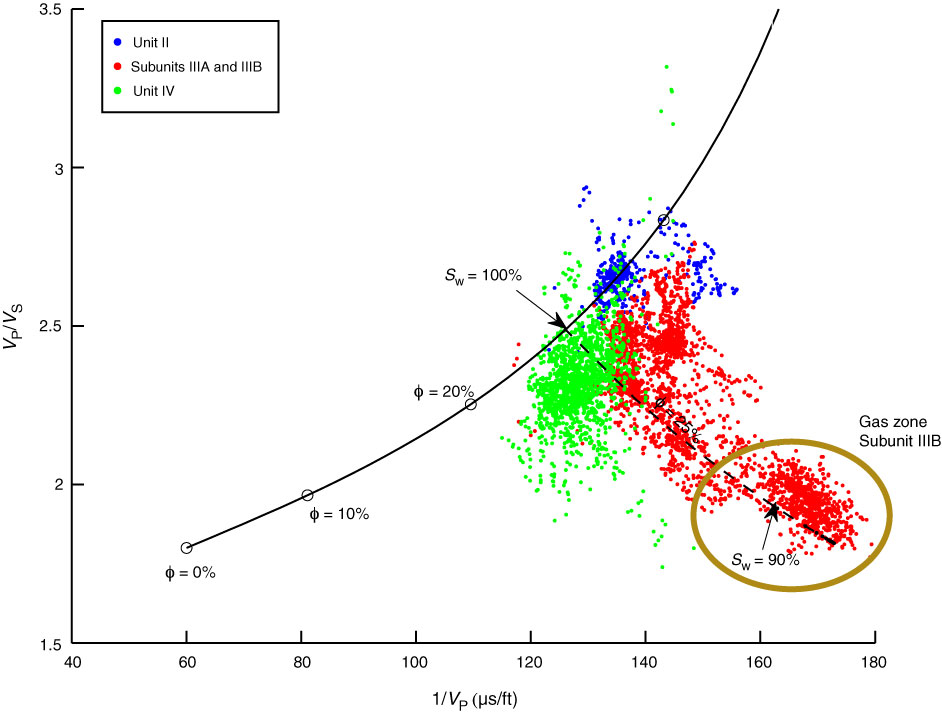
Figure F80. Cross-plot of VP/VS versus P-wave slowness (1/VP). Subunit IIIB is affected by gas saturation. Solid line = theoretical solution for full water saturation (Sw = 100%), circles = expected VP/VS and slowness for porosities (ϕ) of 0%, 10%, and 20%, dashed line = effect of gas as computed by Reuss equation, computed for a porosity of 25% and shows that Subunit IIIB data are consistent with Sw = 90%, and a gas saturation of 10%.
Previous | Close | Next | Top of page