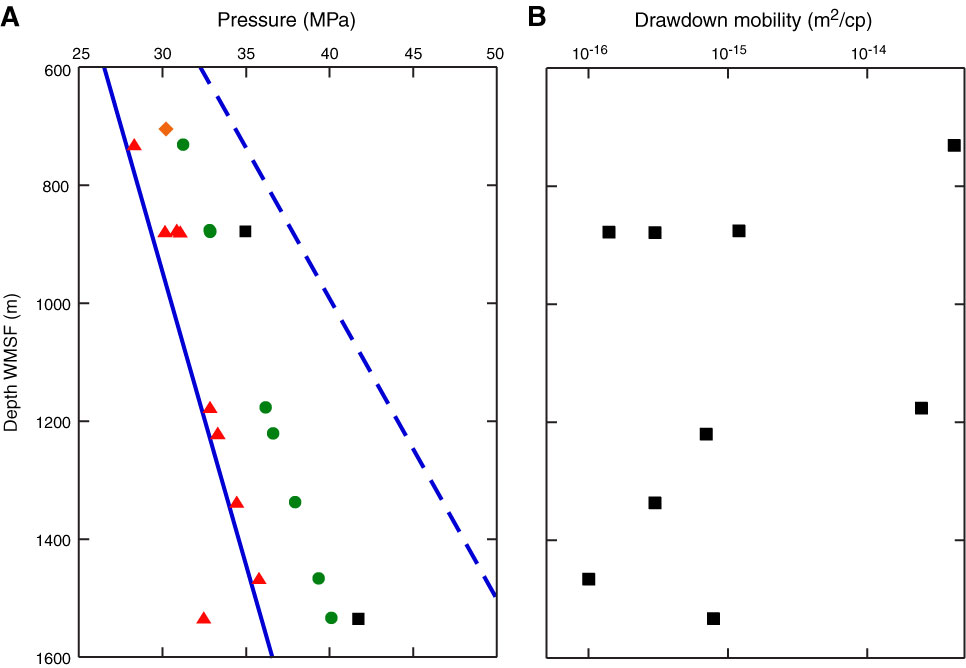
Figure F90. A. Pressure and stress plot versus depth for MDT measurements. Solid line = hydrostatic pressure calculated by assuming both seawater and pore water density of 1023 kg/m3; dashed line = overburden stress (σv) calculated by assuming constant sediment bulk density of 1650 kg/m3 to 475 m WMSF, using MAD data acquired at Expedition 314 Site C0002 from 475–703.9 m WMSF and wireline bulk density acquired at Site C0009 for remainder of hole; red triangles = last pressures recorded during final pressure build-up of single probe tests (SPTs); green circles = pressure of mud in borehole measured by MDT tool at each SPT location (after test); black squares = least principal stress (σ3) interpreted from wireline packer hydraulic fracture test; orange diamond = least principal stress estimated from LOT. B. Drawdown mobility interpreted from SPT tests. Schlumberger suggests values <10–15 m2/cp may be unreliable. 10–5 m2/cp = 1 md/cp.
Previous | Close | Next | Top of page