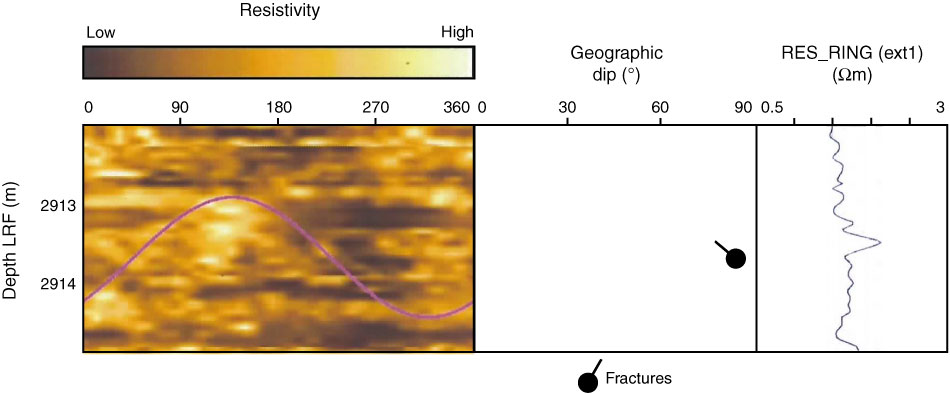
Figure F10. Example of criteria for interpreting faulting from LWD geoVISION resistivity imaging data showing a relatively resistive fault at the sine curve with distinctly different resistivity patterns on opposite sides of sine curve.
Previous | Close | Next | Top of page