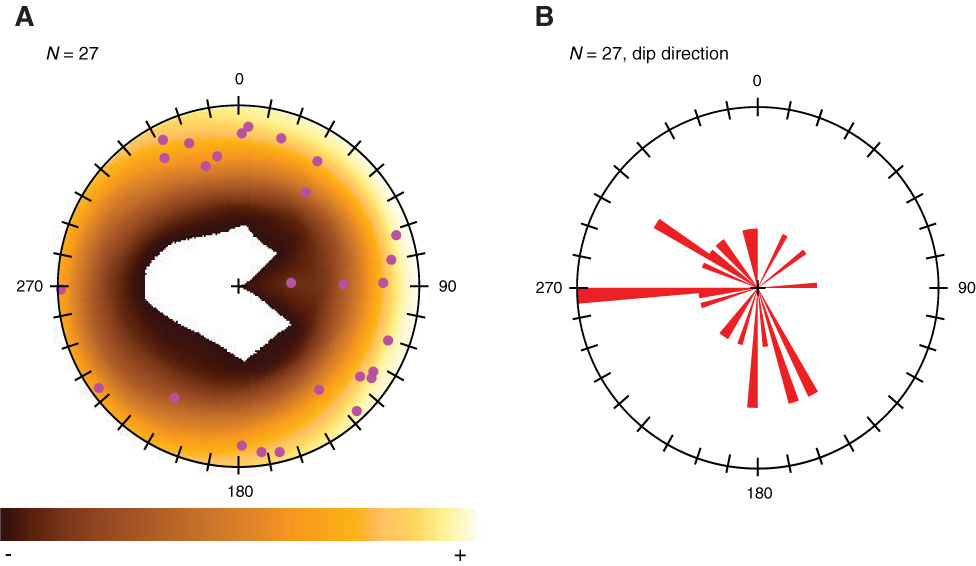
Figure F13. Summary of fault attitudes. A. Contoured plot of poles to faults for all fault measurements. Dots = poles, lighter colors = concentrations of poles, white areas = no poles. B. Rose diagram of dip directions for all faults. Faults most commonly dip west and south, but dip directions exhibit a wide range.
Previous | Close | Next | Top of page