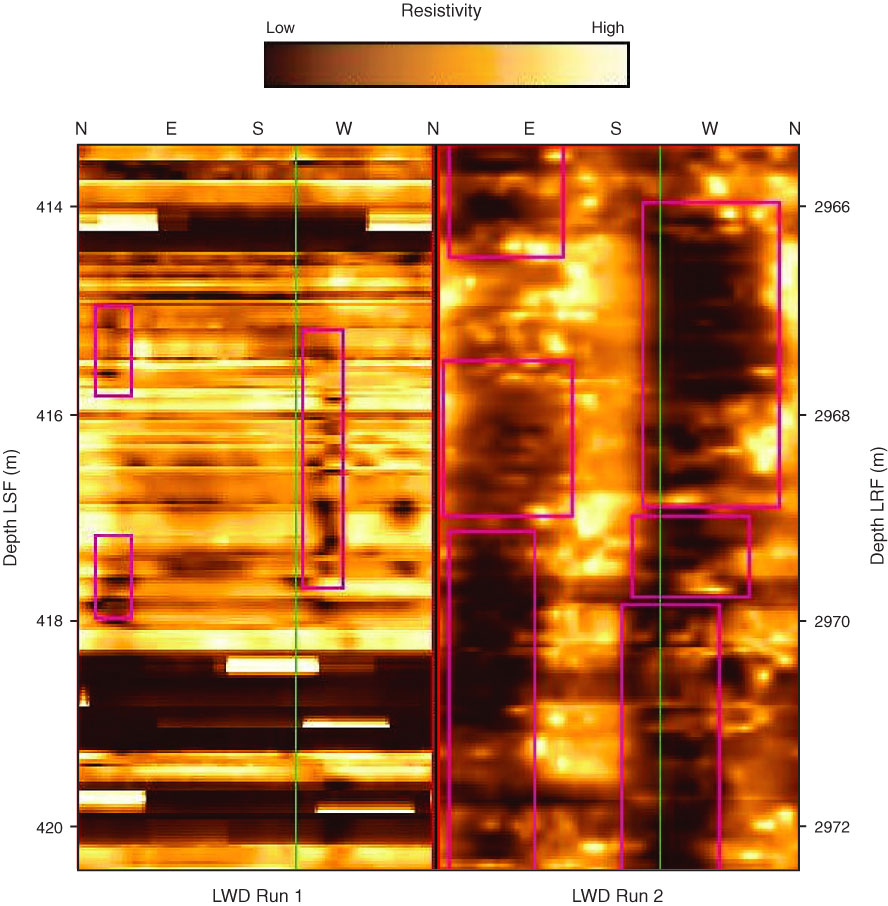
Figure F15. Comparison of resistivity images acquired on Runs 1 and 2 showing breakouts immediately below thrust wedge (lower boundary of thrust wedge at 407 m LSF). Very sharp horizontal contacts shown on Run 1 are artifacts. Artifacts occur throughout section shown at ~20 cm intervals. Breakouts are outlined in magenta. Note widening and increased vertical extent of breakouts in Run 2 in comparison to Run 1. Also note overall consistency of breakout orientation between Runs 1 and 2. Data from Run 2 were used in analysis of breakout geometry in relogged interval. Runs were separated by ~3 days with seawater filling the hole. Note that image data extend to 421 m LSF. LWD = logging while drilling, green vertical line = Pad 1 azimuth (P1AZ).
Previous | Close | Next | Top of page