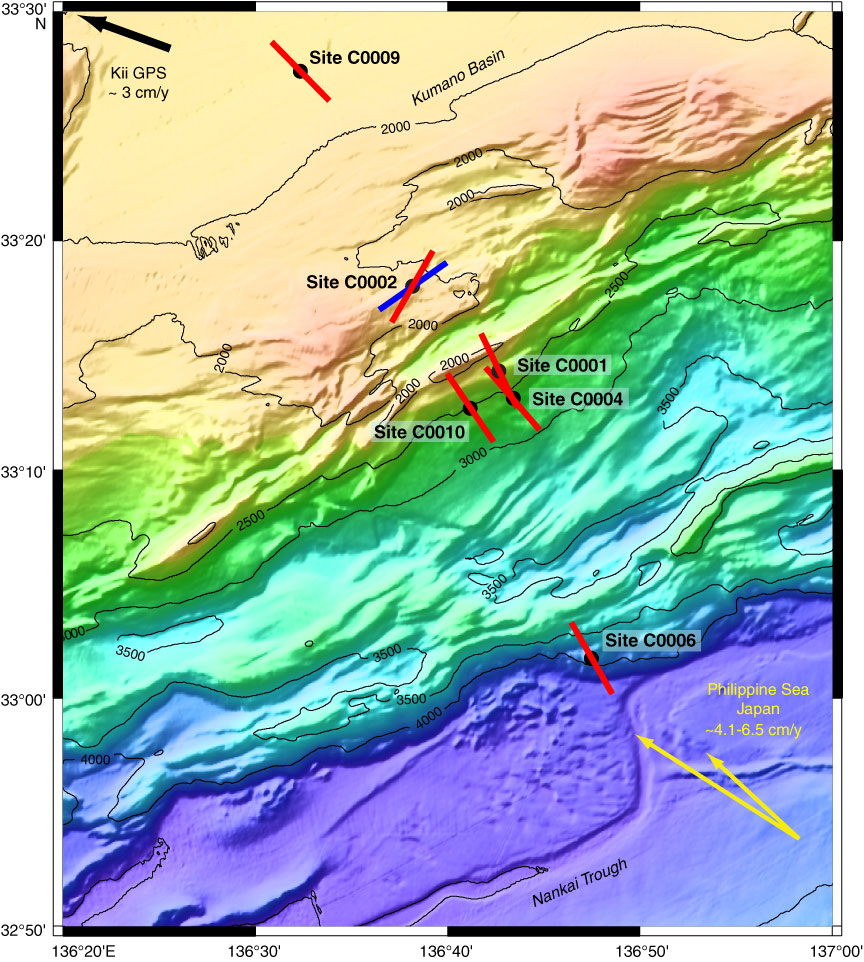
Figure F18. Map showing orientation of SHmax across NanTroSEIZE transect, including results from Site C0010. Red lines = mean value of SHmax direction at all sites, except at Site C0002. At Site C0002, red = SHmax value for upper part of the section, blue = clockwise rotation of SHmax toward bottom of hole (Tobin et al., 2009a). Yellow arrows = relative plate motions between Philippine Sea plate and southwest Japan as estimated by Seno et al. (1993) (shorter more northerly arrow) and Miyazaki and Heki (2001) (longer more westerly arrow). Kii Global Positioning System (GPS) measurement (black arrow) is motion of Kii Peninsula determined relative to an island in Japan Sea (Kamitsushima Island) (Heki, 2007).
Previous | Close | Next | Top of page