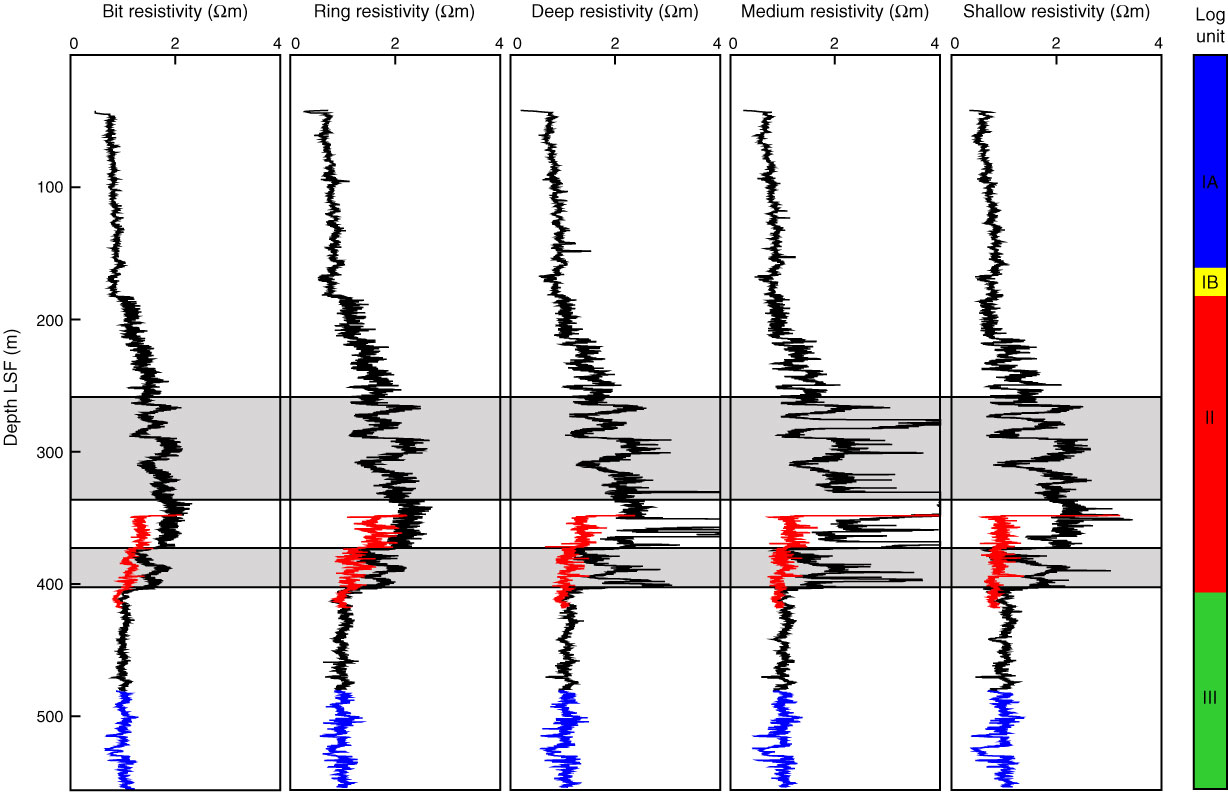
Figure F20. Bit, ring, deep (blue), medium (red), and shallow (green) resistivity versus depth. Black = Run 1, Blue = Run 2, Red = interval relogged in Run 2. Gray shaded areas exhibit considerable variability in resistivity.
Previous | Close | Next | Top of page