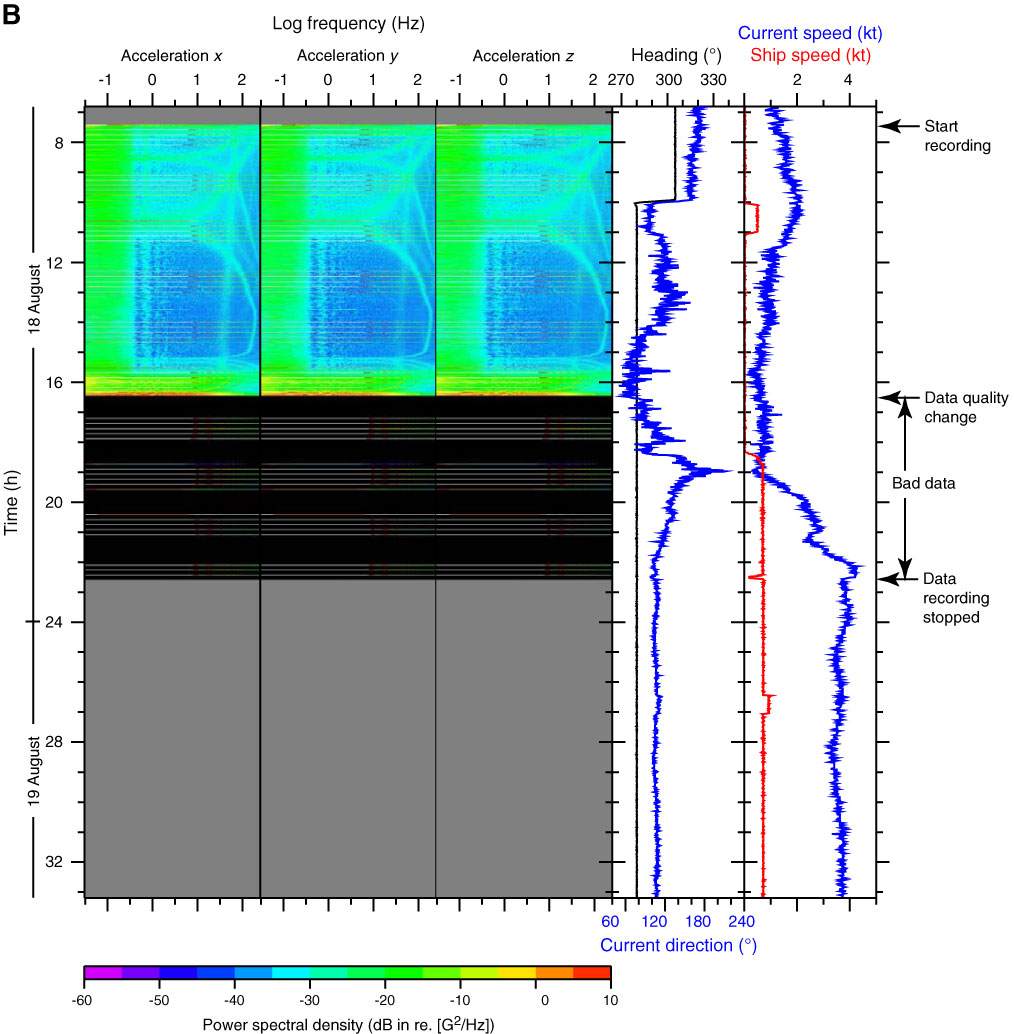
Figure F42 (continued). B. Second dummy run. Vertical and horizontal axes show time (hours) and logarithmic frequency (Hz). Power spectral density is shown in dB in relation to G2/Hz. Events A, B, and C are noted. Ship heading and current speed are shown on the right.
Previous | Close | Next | Top of page