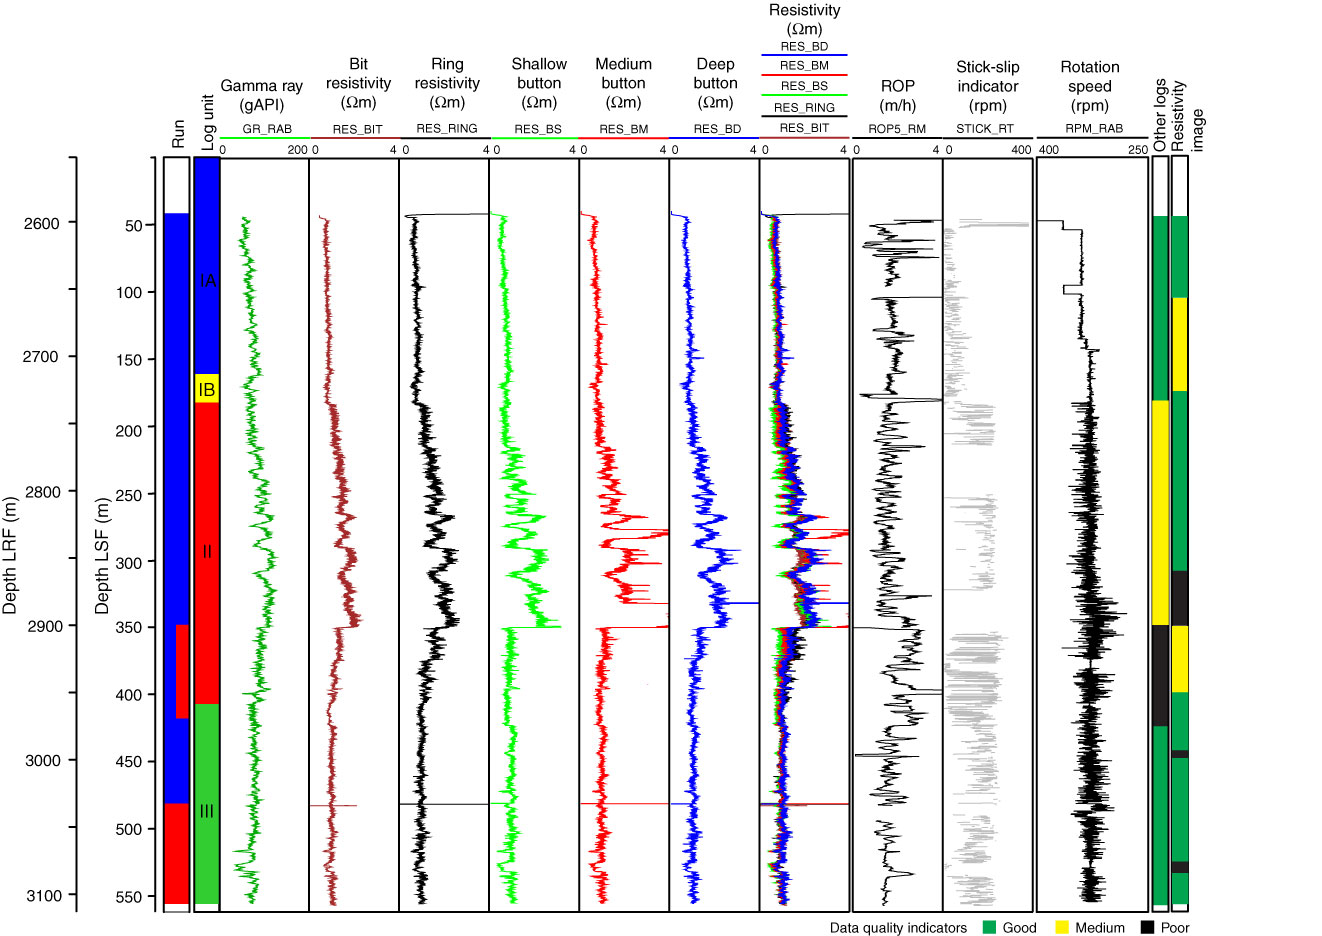
Figure F5. Composite MWD-GVR logs from Hole C0010A with their data quality indicators. From left to right: depths; logging run columns (blue = Run 1, red = Run 2); logging units; gamma ray; bit, ring, shallow, medium, and deep resistivities; rate of penetration (ROP) averaged over last 5 ft; stick-slip; rotation speed and data quality indicator columns for resistivity image and scalar logs. rpm = rotations per minute.
Previous | Close | Next | Top of page