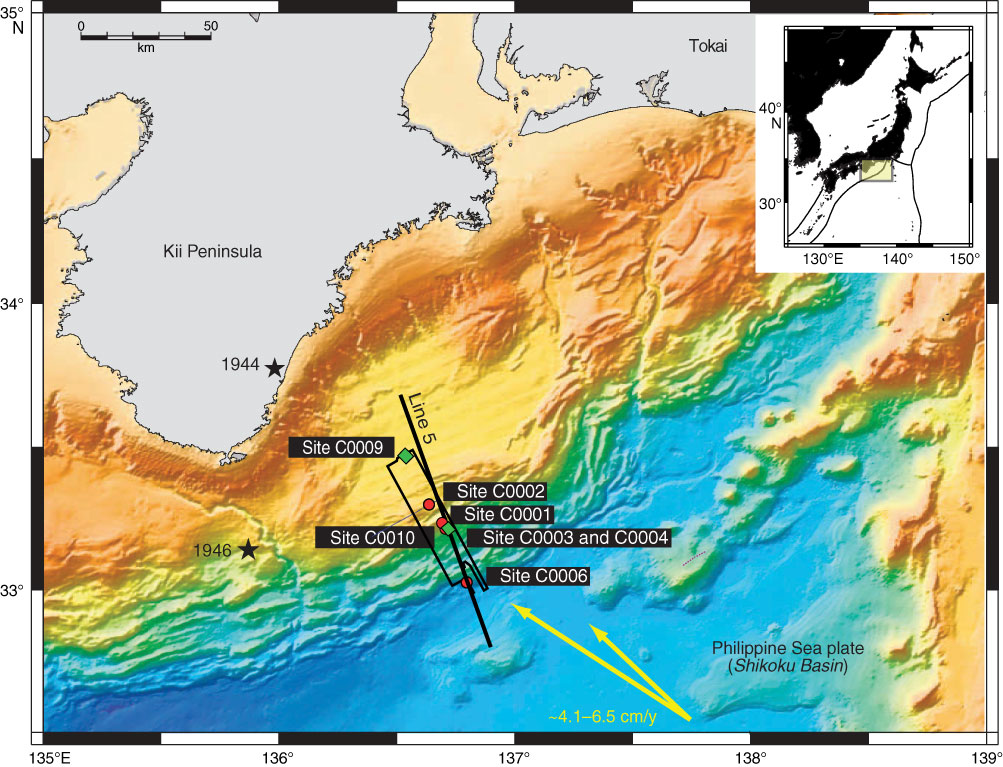
Figure F1. Map of study area showing drill sites, Sites C0009 and C0010 (green diamonds) (modified from Saffer et al., 2009). Red circles = NanTroSEIZE Stage 1 sites, black box = location of 3-D reflection data acquisition in 2006, yellow arrows = vectors estimated far-field between Philippine Sea plate and Japan (Heki, 2007; Seno, 1993), stars = large earthquakes in the past.
Close | Next | Top of page