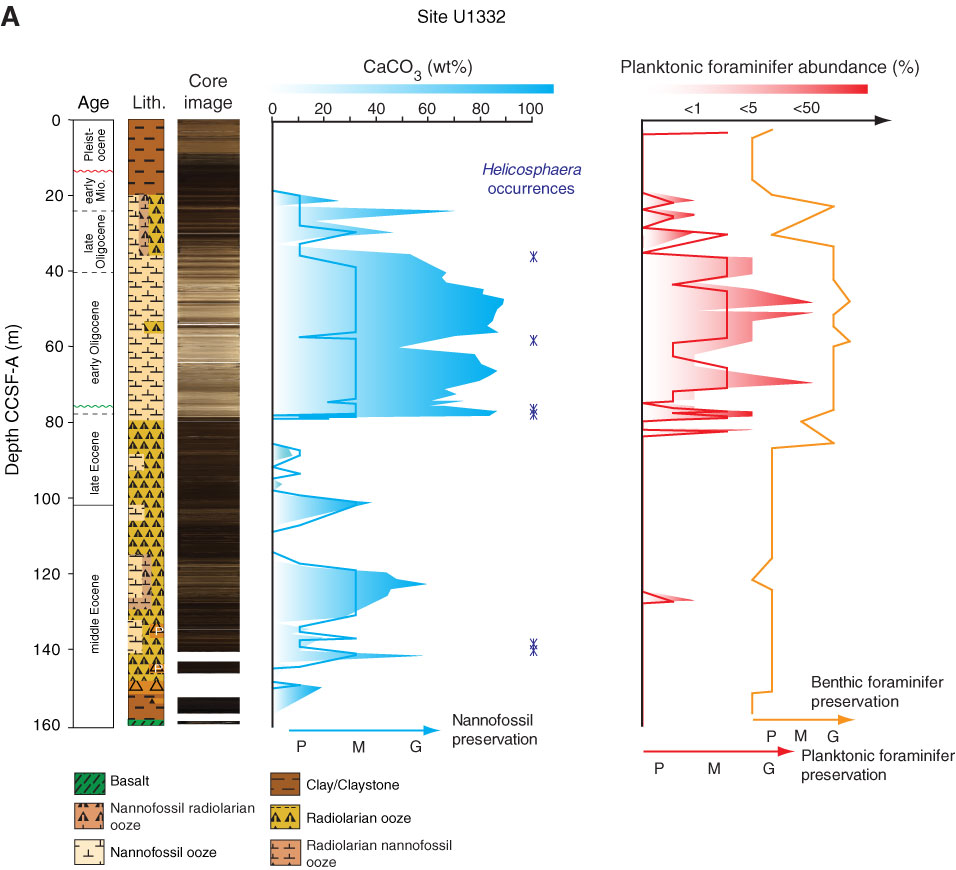
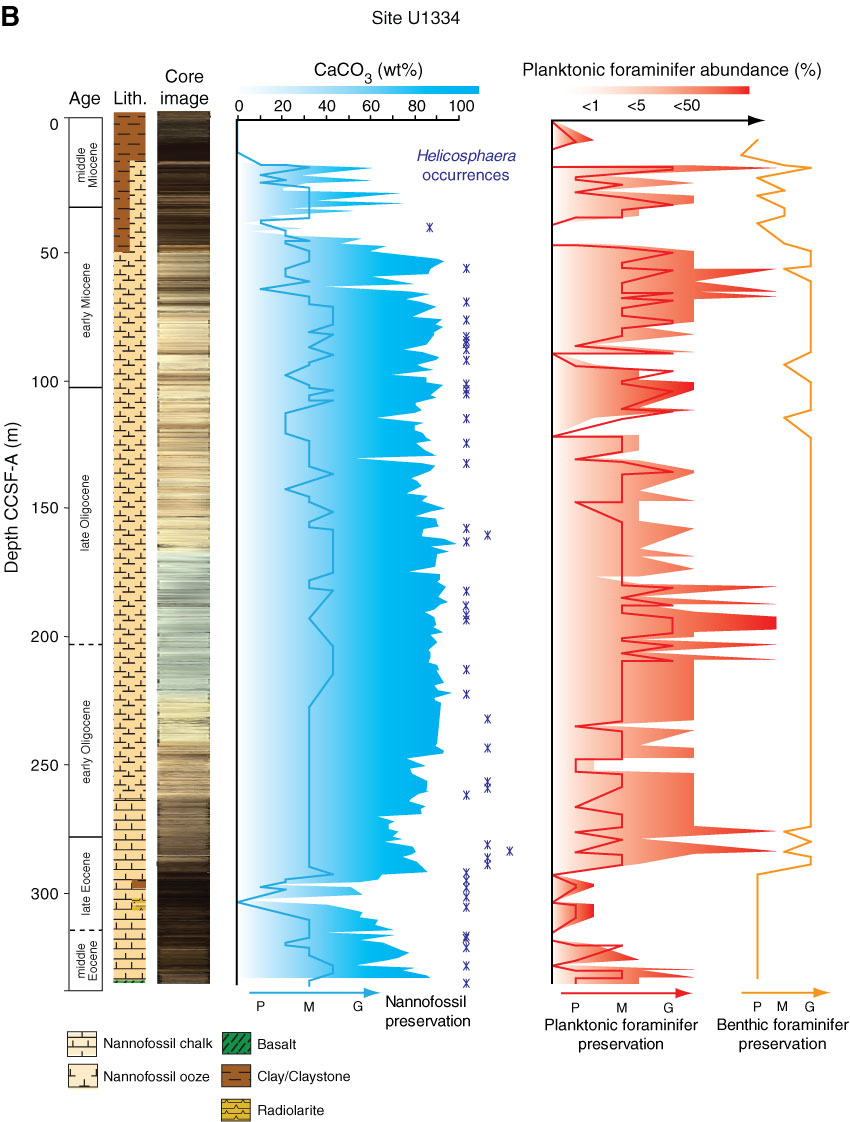
Figure F18. Carbonate content vs. preservation and abundance of calcareous microfossil groups. Blue shading = wt% CaCO3, blue line = nannofossil preservation, purple crosses = abundance of coccolith taxon Helicosphaera (all from Hole A). Red shading = semiquantitative assessment of planktonic foraminifer abundance (percent of planktonics vs. other grains), red line = planktonic foraminifer preservation, orange line = benthic foraminifer preservation (all with compiled data from Holes A, B, and C). Preservation: G = good, M = medium, P = poor. Core composite images are from Hole A. A. Site U1332. B. Site U1334.
Previous | Close | Next | Top of page