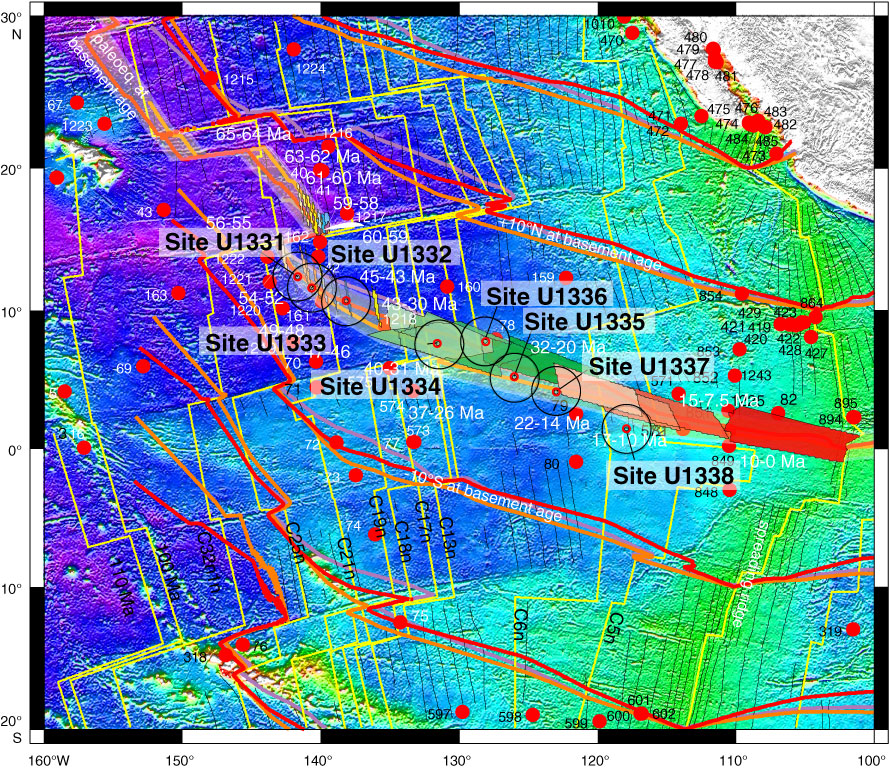
Figure F4. Location map of drill sites with backtracked position of paleoequator, corresponding to time slices targeted. Gray scale = present-day bathymetry (darker = deeper), thin yellow lines = revised magnetic anomaly isochrons (modified with new points from Petronotis, 1991, and Petronotis et al., 1994). Paleoequator position at crustal age obtained by backtracking, using fixed-hotspot stage poles from Koppers et al. (2001; pink) and Engebretson et al. (1985; orange) and paleomagnetic poles from Sager and Pringle (1988; purple). Shaded band lies within 1° north and south of the paleoequator (averaged from fixed-hotspot rotation models). Colored areas = time intervals of interest obtained by intersecting white paleoequator area with younger end of the time interval of interest, which was then backrotated to the older boundary of the time slice. Method requires correction if backtracking occurs across fracture zones. Positions of PEAT sites as plotted are slightly different to final positions. Locations of previous DSDP and ODP sites are also shown.
Previous | Close | Next | Top of page