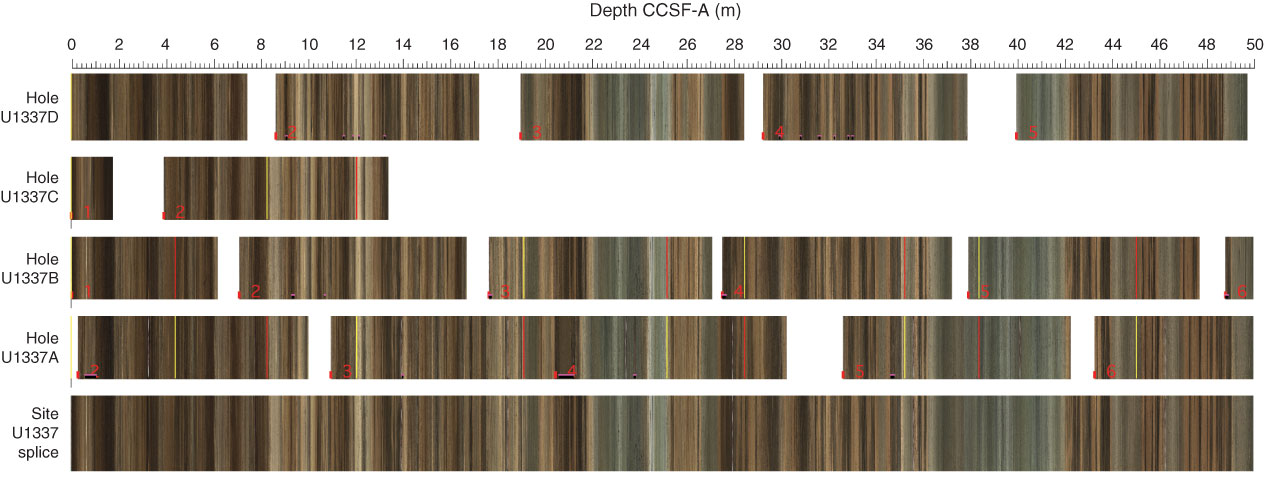
Figure F51. Digital line scan images, Site U1337. Red lines = base of a splice interval (tie point), yellow lines = top of the next splice interval (tie point). Images were depth registered by Roy Wilkens using IGOR-Pro software.
Previous | Close | Next | Top of page