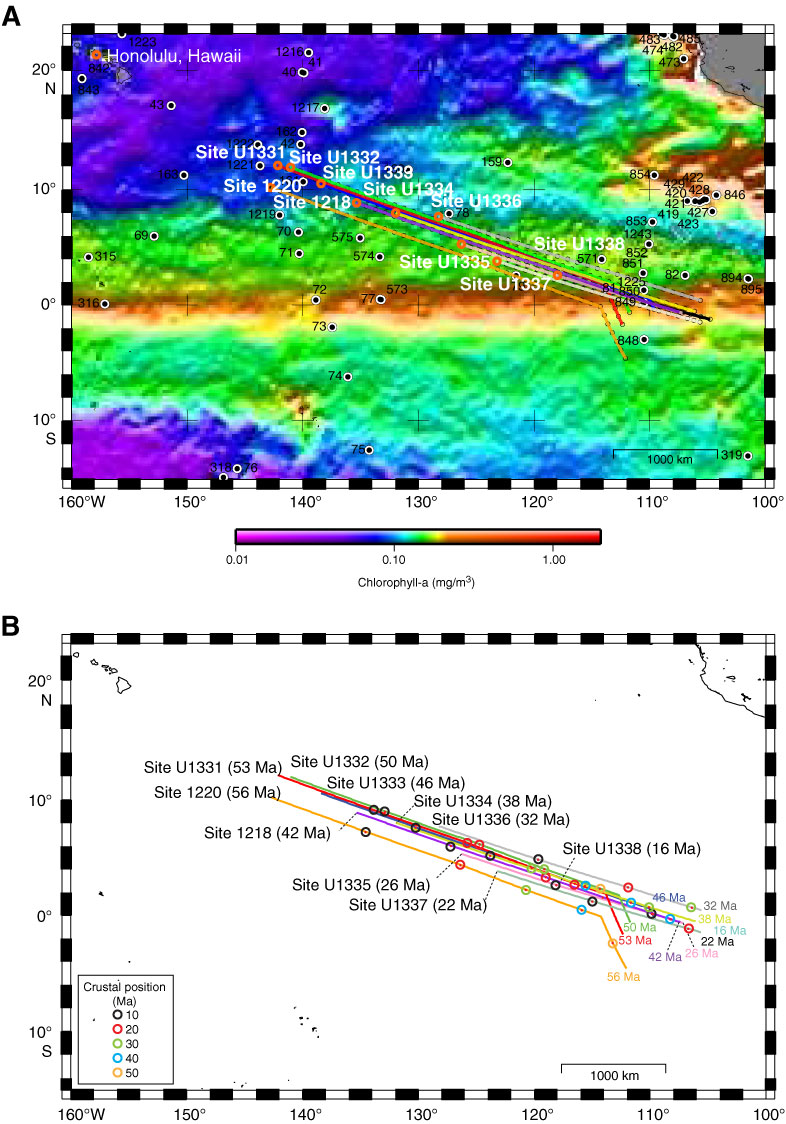
Figure F6. A. Backtracked positions for PEAT sites (red circles), using stage poles from Koppers et al. (2001) superimposed on a satellite-derived (GlobColour) map of present ocean chlorophyl-a concentrations (December 2005 mean monthly). Red = high productivity, blue = low productivity. Solid circles = previous DSDP and ODP sites. B. Backtracked positions for PEAT sites, with annotated positions every 10 m.y. back from present. Estimated basement ages for each site while situated at paleo–ridge crest are noted.
Previous | Close | Next | Top of page