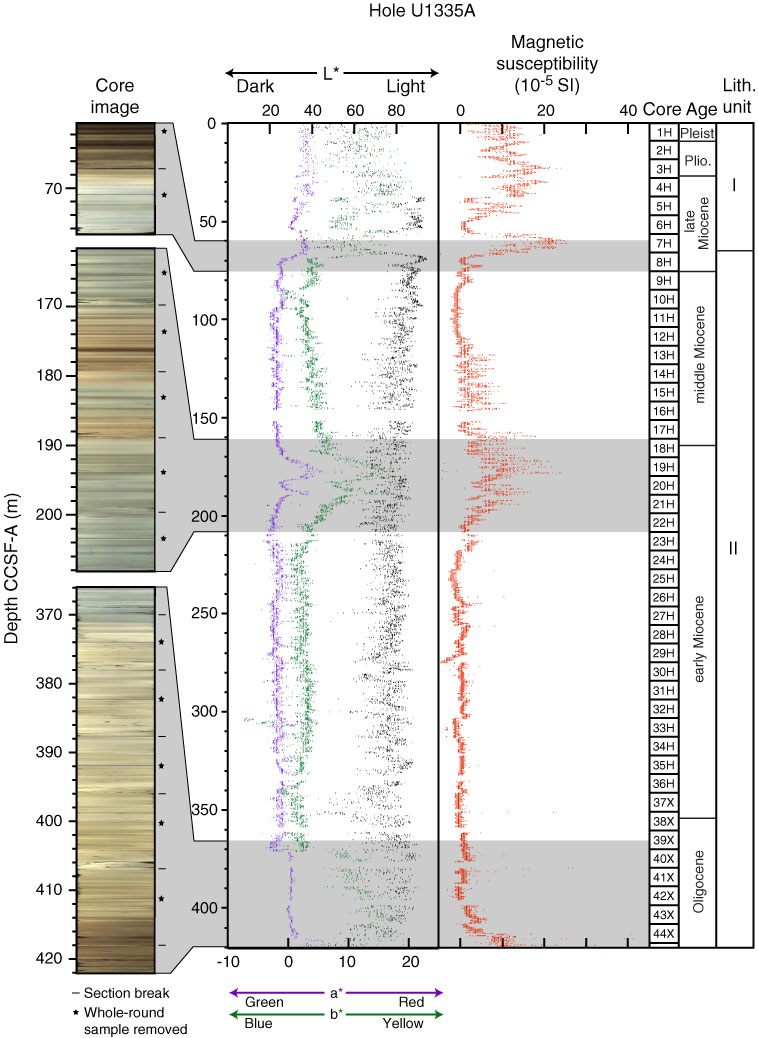
Figure F71. Color reflectance and magnetic susceptibility, Hole U1335A. Line scan images from Cores 320-U1335A-7H through 8H, 18H through 22H, and 39X through 45X highlight observed color changes. L*, a*, b* = reflectance value of sediment as defined in the LAB color model.
Previous | Close | Next | Top of page