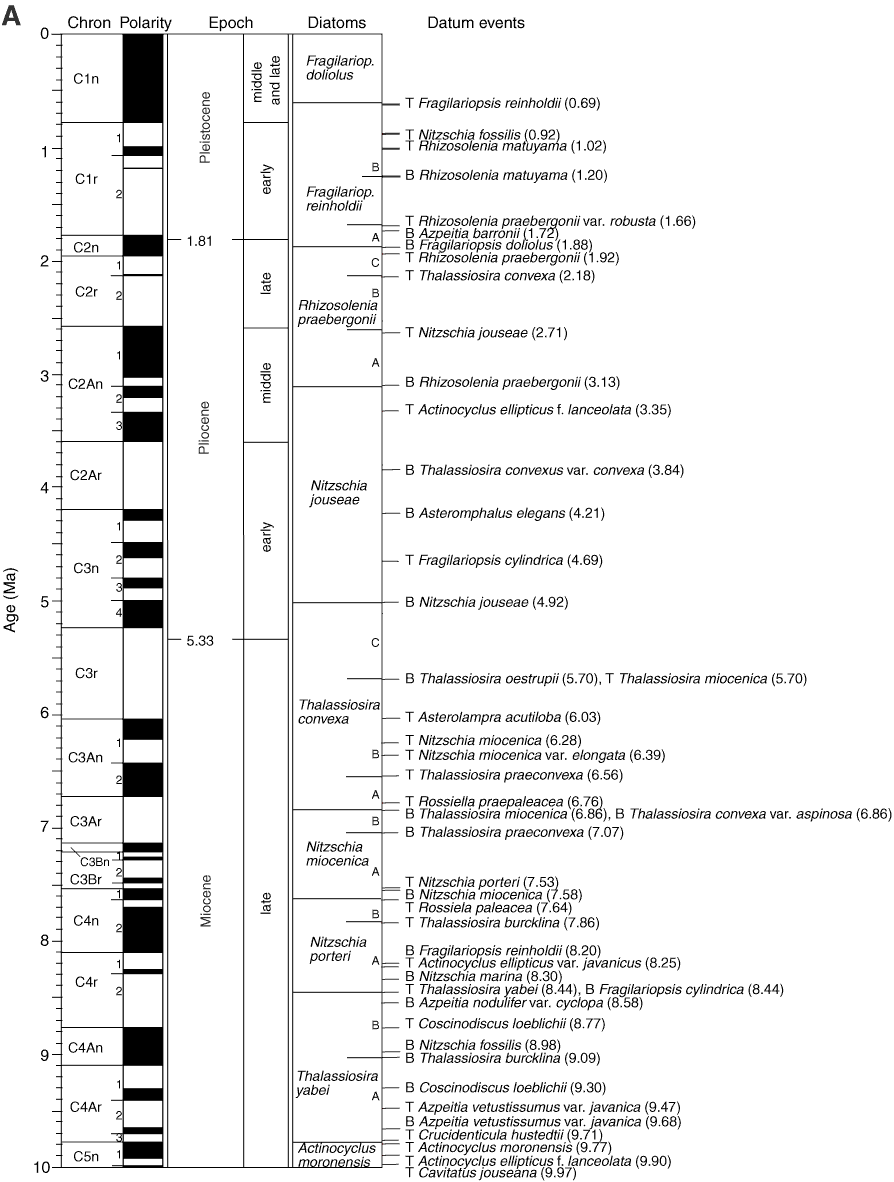
Figure F4. Timescale used for IODP Expedition 320/321 with diatom zones and datums through the interval 0 to 60 Ma. Bold datums define zonal boundaries. B = base, T = top. A. 0–10 Ma. (Continued on next three pages.)
Previous | Close | Next | Top of page