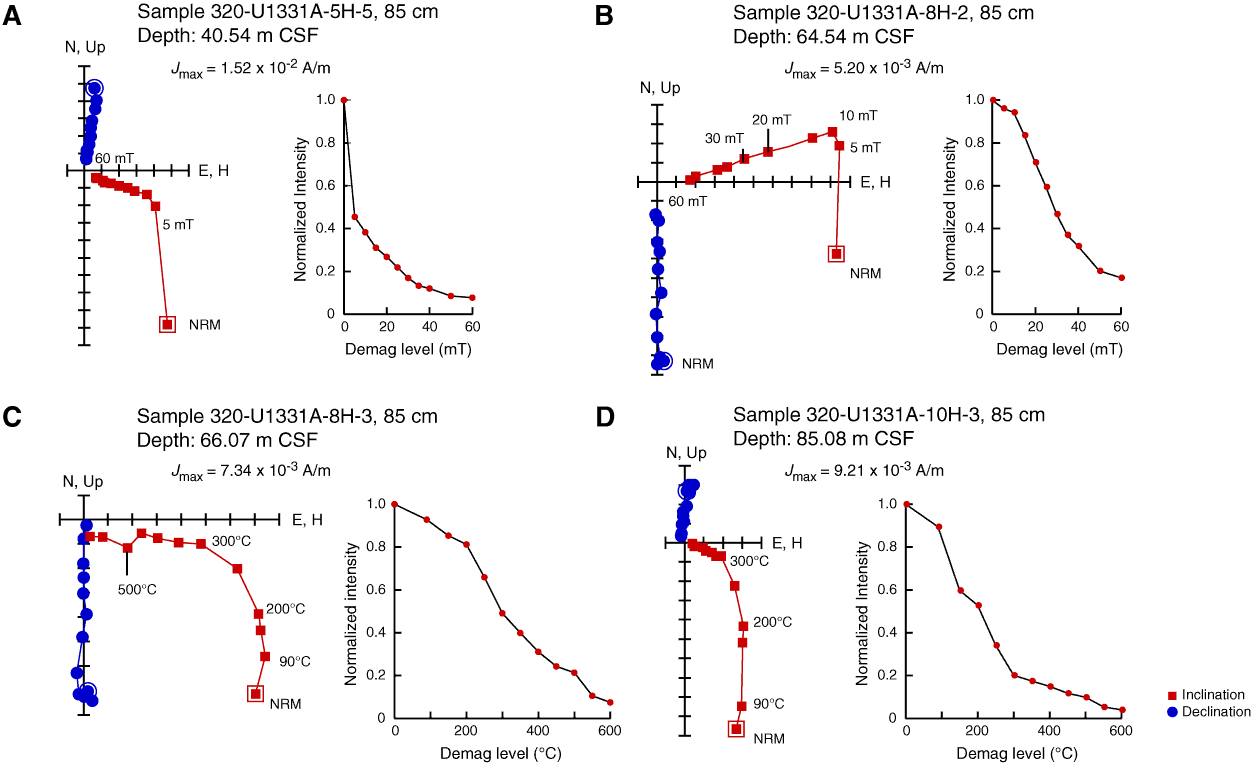
Figure F19. Alternating-field and thermal demagnetization (demag) results for four discrete samples. Left plot shows vector endpoints of paleomagnetic directions on vector demagnetization diagrams or modified Zijderveld plots (squares = inclinations, circles = declinations), right plot shows intensity variation with progressive demagnetization. All four vector demagnetization diagrams illustrate removal of a steep drilling overprint by about 15 mT or 300°C, with the remaining magnetization providing a well-resolved characteristic remanent magnetization. A. Sample 320-U1331A-5H-5, 85 cm (40.54 m CSF). B. Sample 320-U1331A-8H-2, 85 cm (64.54 m CSF). C. Sample 320-U1331A-8H-3, 85 cm (66.07 m CSF). D. Sample 320-U1331A-10H-3, 85 cm (85.08 m CSF). NRM = natural remanent magnetization.
Previous | Close | Next | Top of page