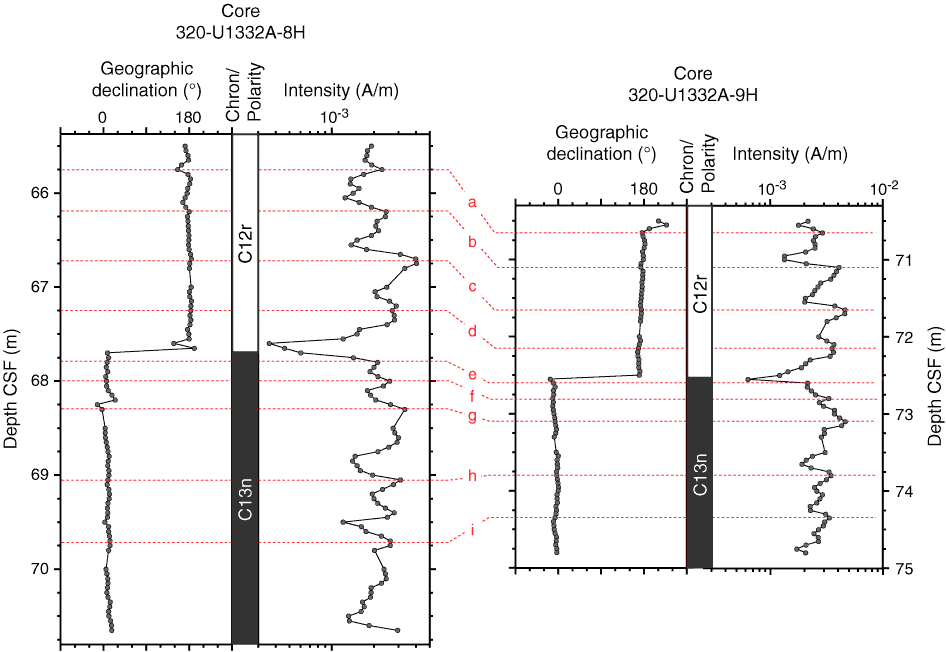
Figure F20. Variations of geographic declinations and remanent magnetization (after 20 mT demagnetization) for the slump interval in Cores 320-U1332A-8H and 9H. Correlatable variations in intensity are marked by letters a–i.

Previous | Close | Next | Top of page