Previous | Close | Next
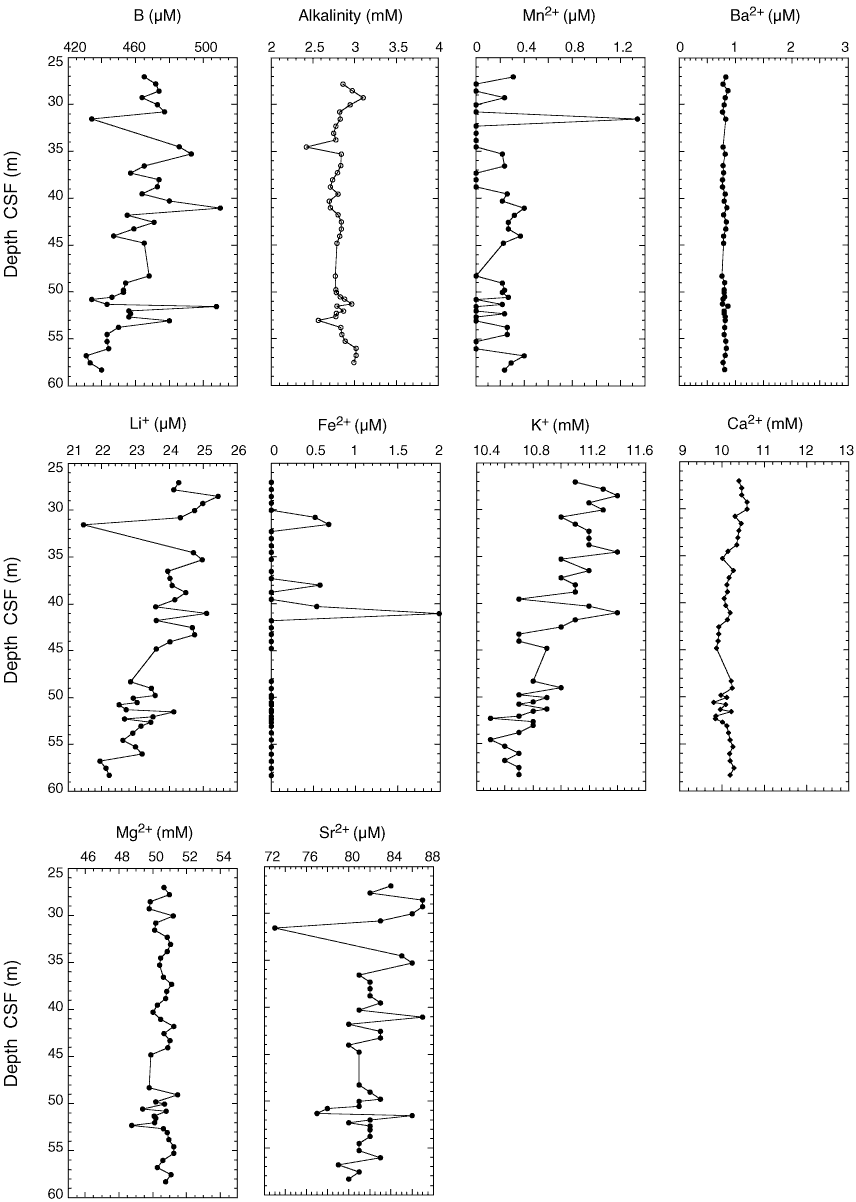
Figure F24. Interstitial water chemistry data from Rhizon samples, Hole U1332C. Values below the detection limit (see Table T27) are plotted as zero.
Previous | Close | Next | Top of page