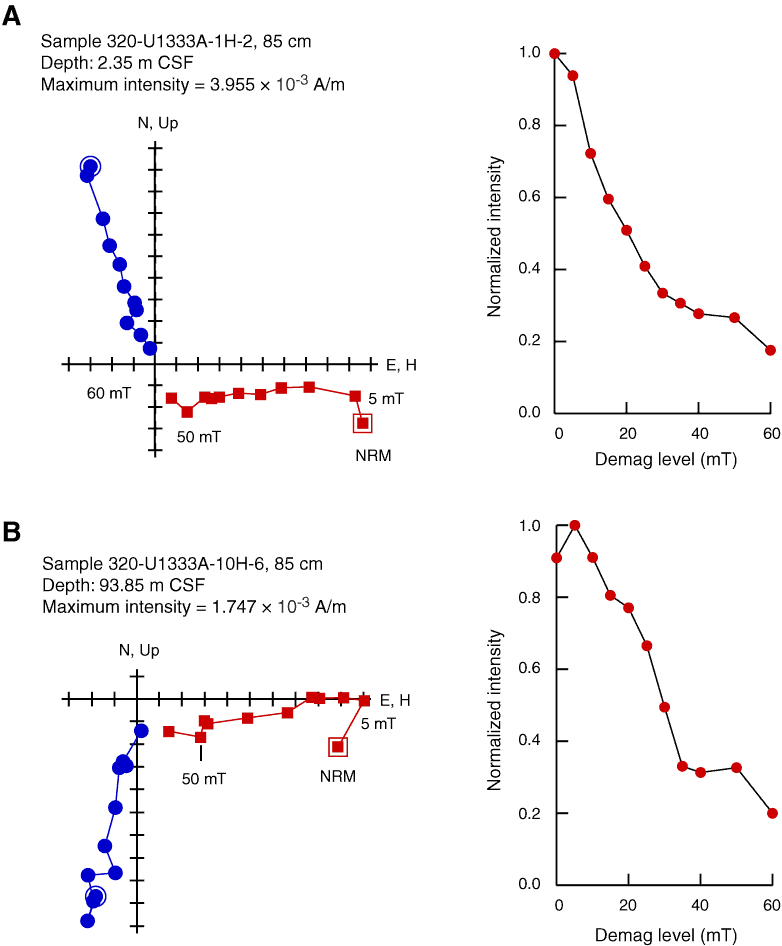
Figure F16. Alternating-field demagnetization (demag) results for two discrete samples. Left plot shows vector endpoints of paleomagnetic directions on vector demagnetization diagrams or modified Zijderveld plots (squares = inclinations, circles = declinations), right plot shows intensity variation with progressive demagnetization. Data illustrate removal of drilling overprint, which is small in these samples. Above the 10 mT demagnetization step, a stable component is observed, which we interpret as the ChRM. Vectors do not terminate at the origin of plots, which might indicate instrument noise. A. Sample 320-U1333A-1H-2, 85 cm (2.35 m CSF). B. Sample 320-U1333A-10H-6, 85 cm (93.85 CSF). NRM = natural remanent magnetization.

Previous | Close | Next | Top of page