Previous | Close | Next
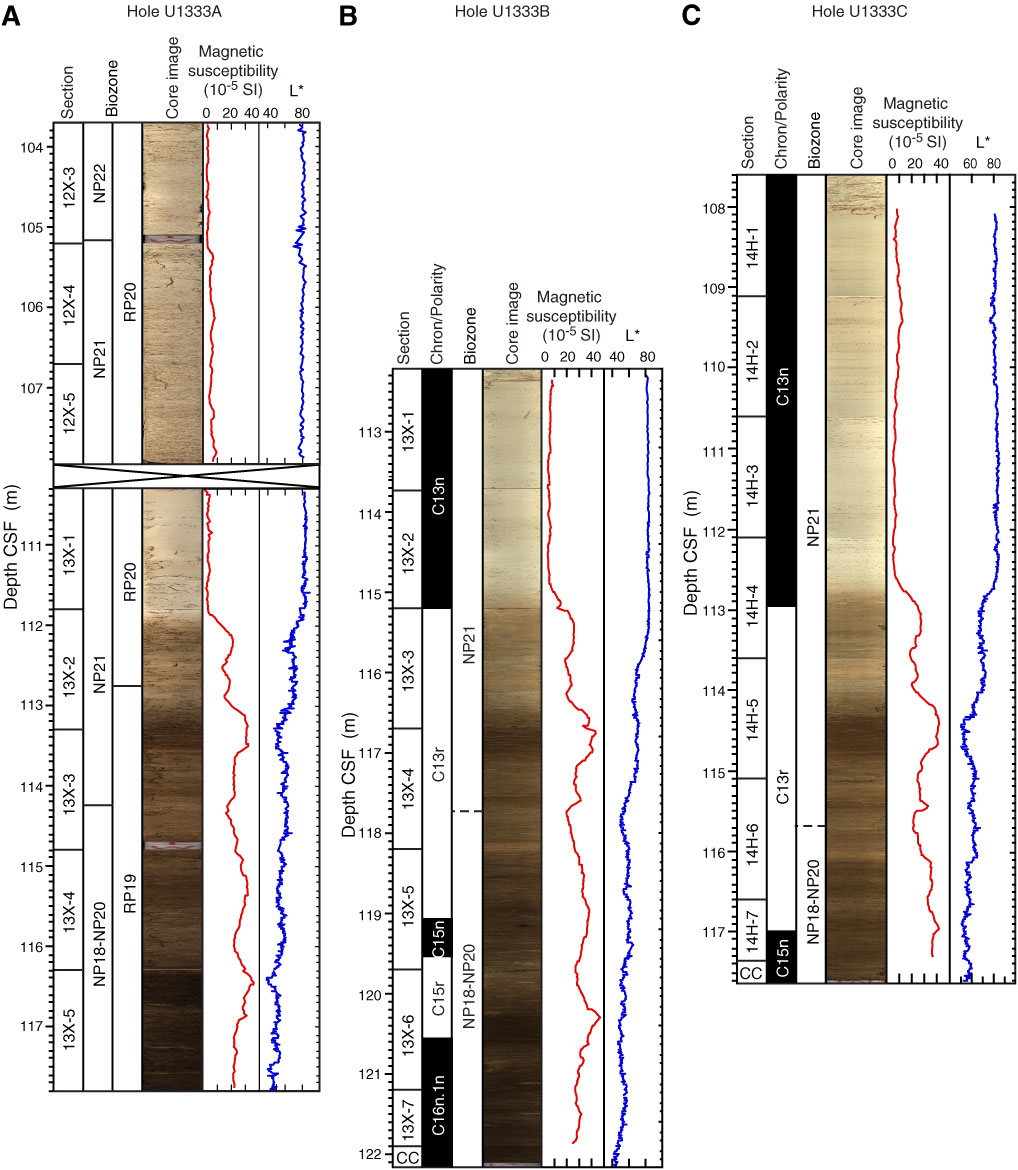
Figure F7. Line scan images of Eocene–Oligocene transition. A. Hole U1333A. B. Hole U1333B. C. Hole U1333C. L* = reflectance value of sediment as defined in the LAB color model.
Previous | Close | Next | Top of page