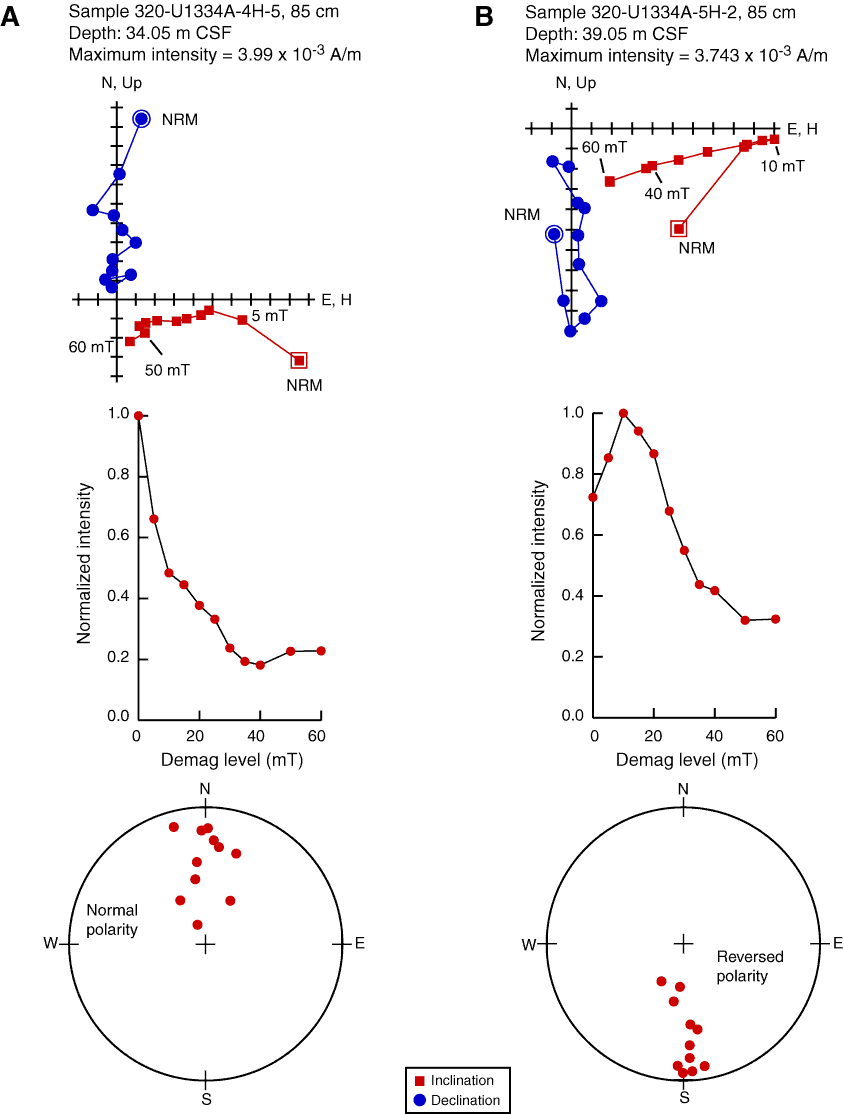
Figure F20. Alternating-field demagnetization (demag) results representative of some of the best samples from Site U1334. Top plot shows vector endpoints of paleomagnetic directions on vector demagnetization diagrams or modified Zijderveld plots (squares = inclinations, circles = declinations), middle plot = intensity variation with progressive demagnetization, bottom plot = directions plotted on an equal-angle stereonet (Wulff projection). Data illustrate the removal of a steep drilling overprint by ~10 mT, with the remaining magnetization providing a relatively well resolved characteristic remanent magnetization. A. Sample 320-U1334A-4H-5, 85 cm (34.05 m CSF). B. Sample 320-U1334A-5H-2, 85 cm (39.05 m CSF). NRM = natural remanent magnetization.

Previous | Close | Next | Top of page