Previous | Close | Next
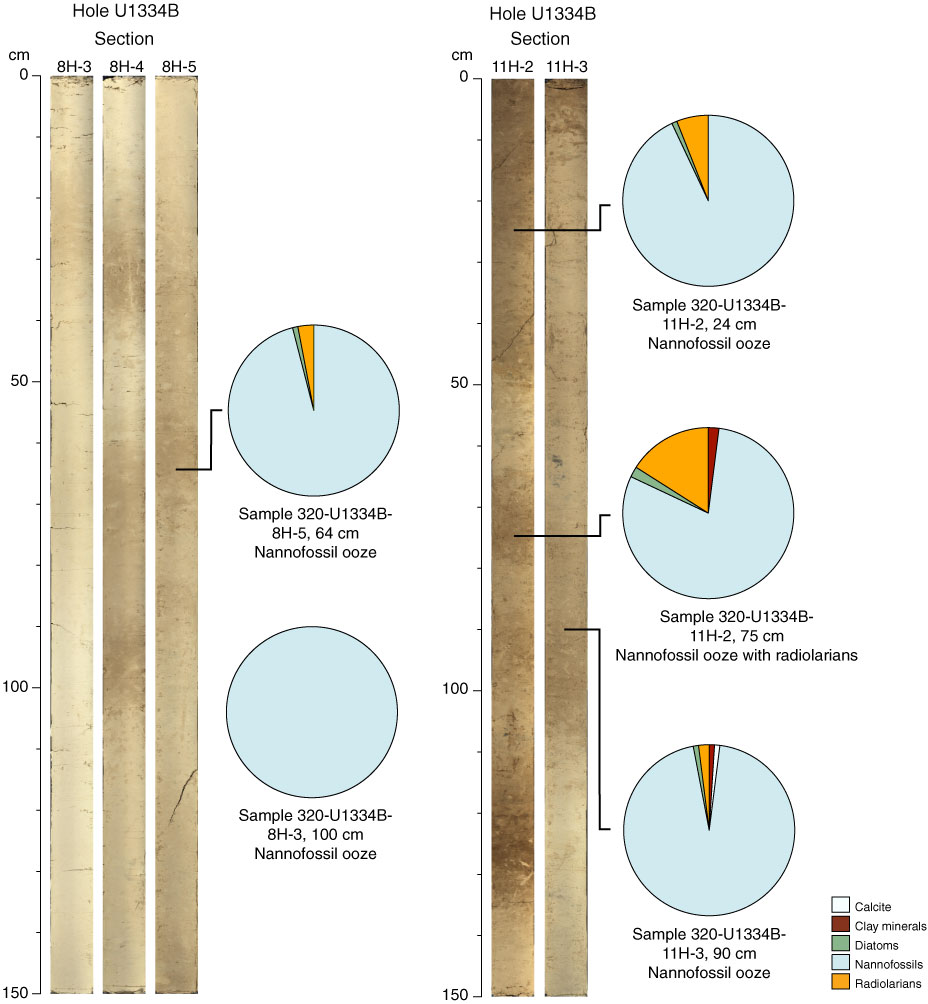
Figure F8. Subtle color variations in Sections 320-U1334B-8H-3 through 8H-5 and 11H-2 and 11H-3. Pie charts show the compositions of sediments based on smear slide descriptions.
Previous | Close | Next | Top of page