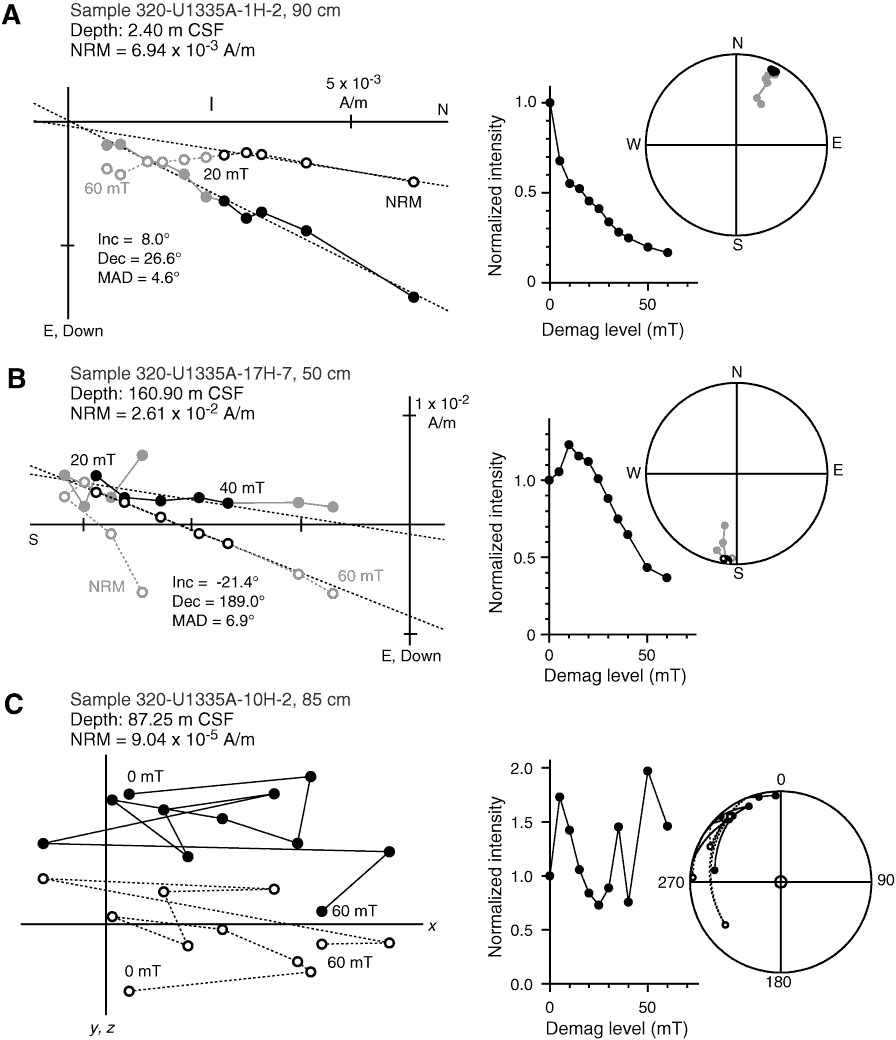
Figure F16. Representative alternating-field demagnetization (demag) results for Site U1335 samples. Left plot = vector endpoints of paleomagnetic directions on vector demagnetization diagrams or Zijderveld plots (solid circles = horizontal projections, open circles = vertical projections, gray circles = data not used in computing ChRM, black dashed line = ChRM direction), middle plot = intensity variation with progressive demagnetization, right plot = directions plotted on an equal-angle stereonet. Vector demagnetization diagrams of A and B show relatively well resolved characteristic remanent magnetizations, whereas that of C does not. A. Normal polarity sample (320-U1335A-1H-2, 90 cm) (2.40 m CSF) B. Reversed polarity sample (320-U1335A-17H-7, 50 cm) (160.90 m CSF). C. Weakly magnetized sample from the magnetic-low zone (Sample 320-U1335A-10H-2, 85 cm) (87.25 m CSF). NRM = natural remanent magnetization. Inc = inclination, Dec = declination, MAD = maximum angular deviation.

Previous | Close | Next | Top of page