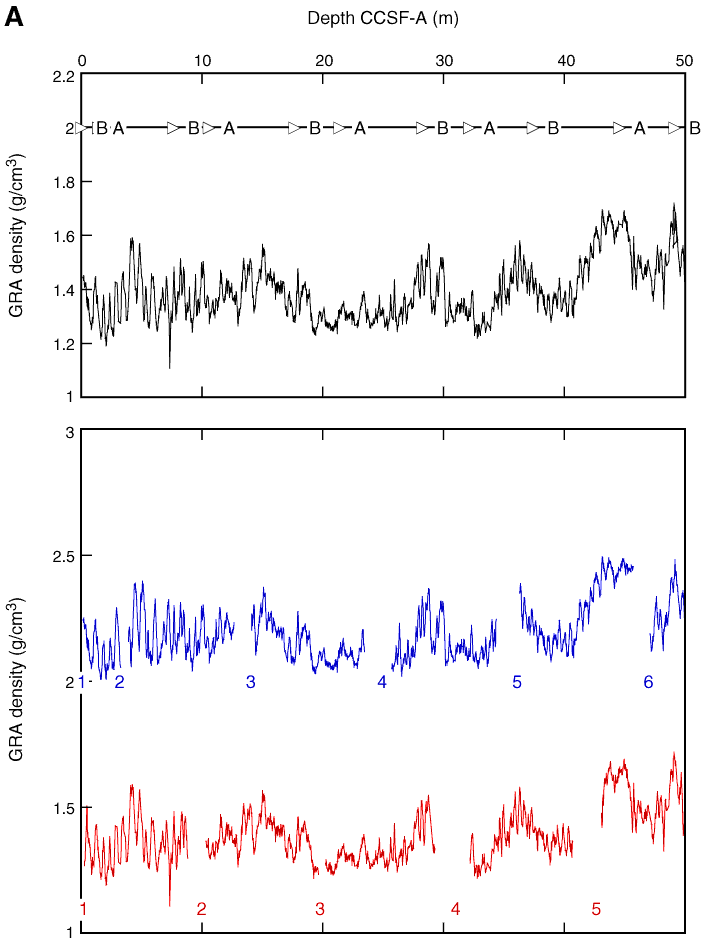
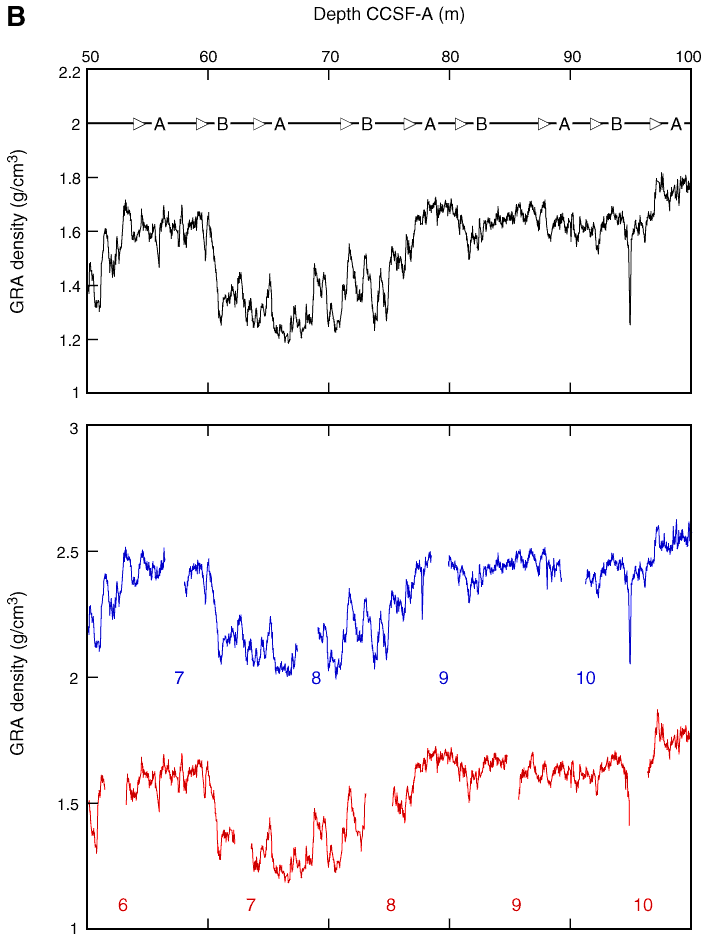
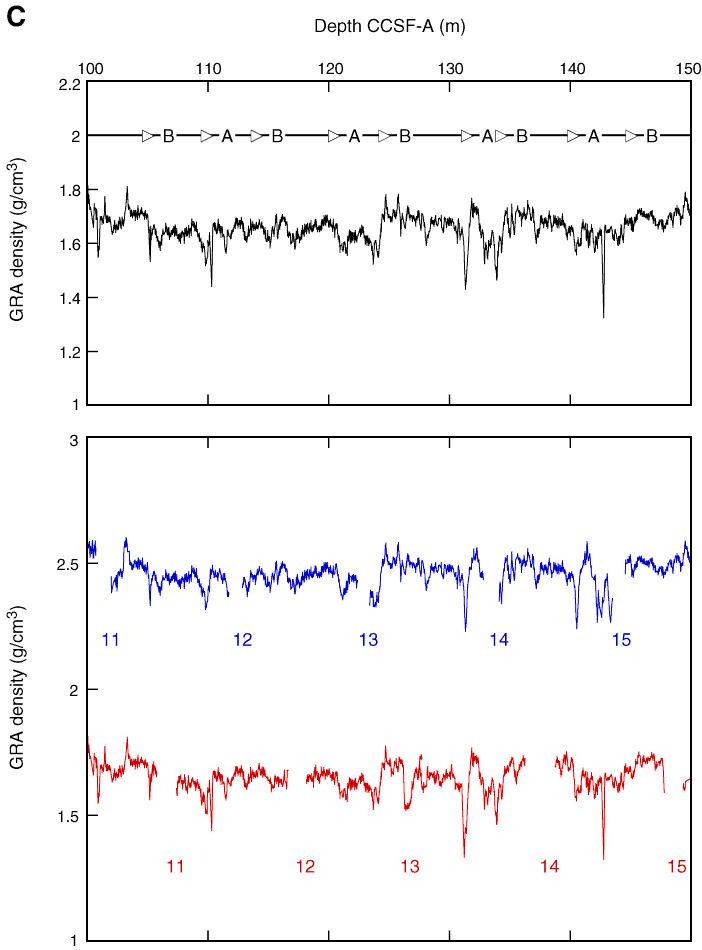
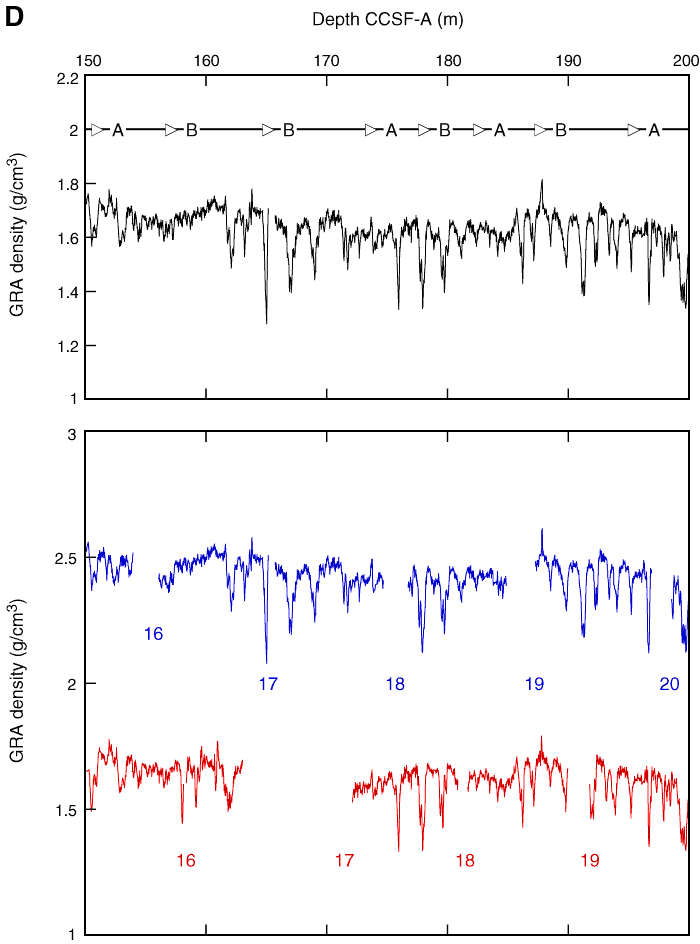
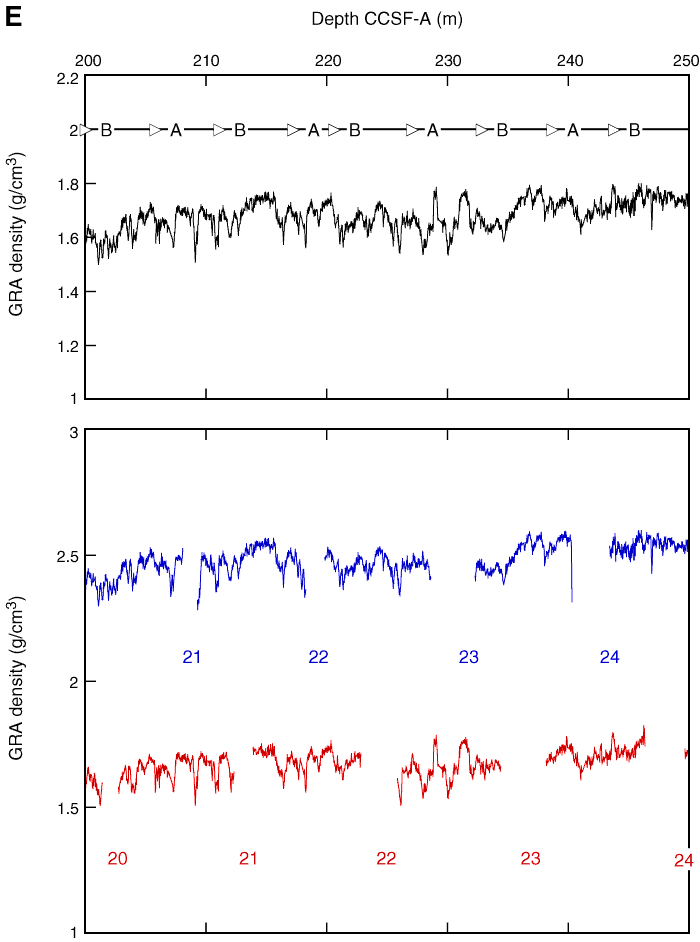
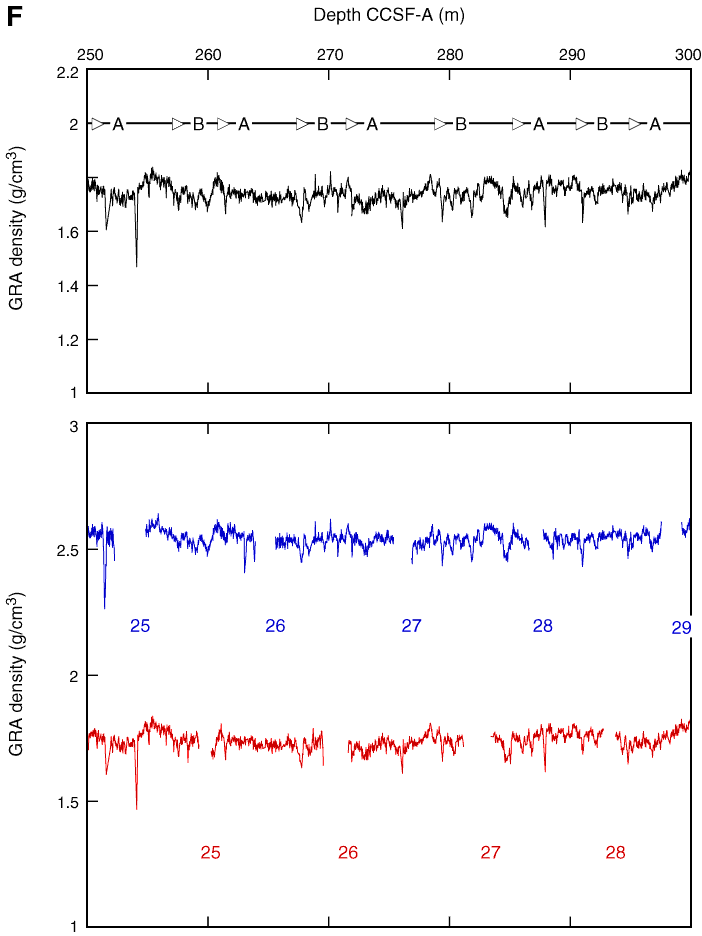
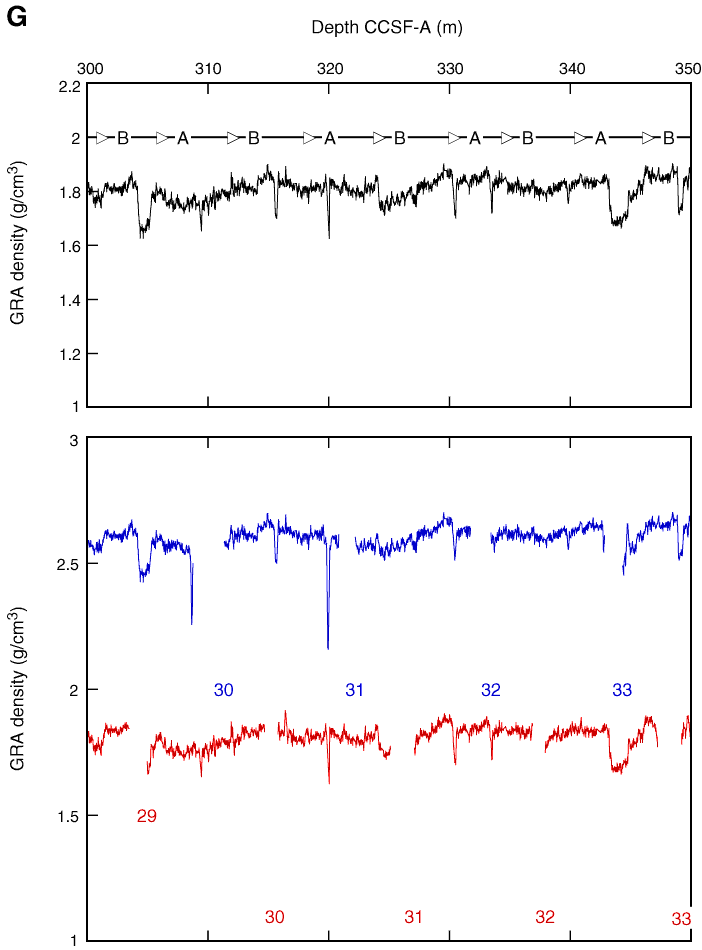
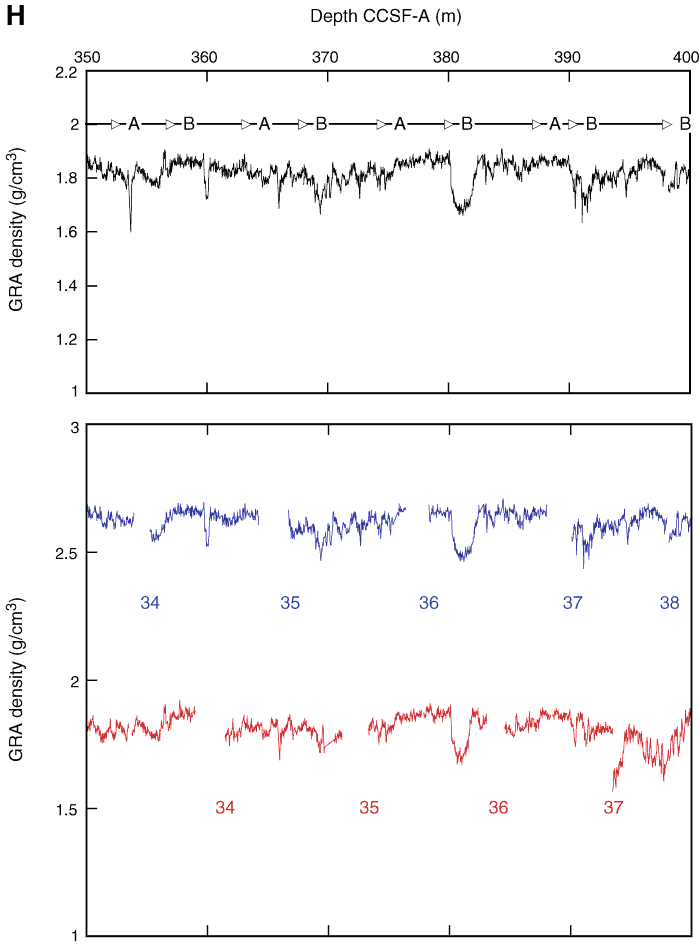
Figure F28. Gamma ray attenuation (GRA) density data, Site U1335. Top panel = spliced section with core breaks (triangles) and hole designations, bottom panel = Holes U1335A (red) and U1335B (blue), offset from each other by a constant (0.8 g/cm3). A. 0–50 m CCSF-A. B. 50–100 m CCSF-A. C. 100–150 m CCSF-A. D. 150–200 m CCSF-A. E. 200–250 m CCSF-A. F. 250–300 m CCSF-A. G. 300–350 m CCSF-A. H. 350–400 m CCSF-A.
Previous | Close | Next | Top of page