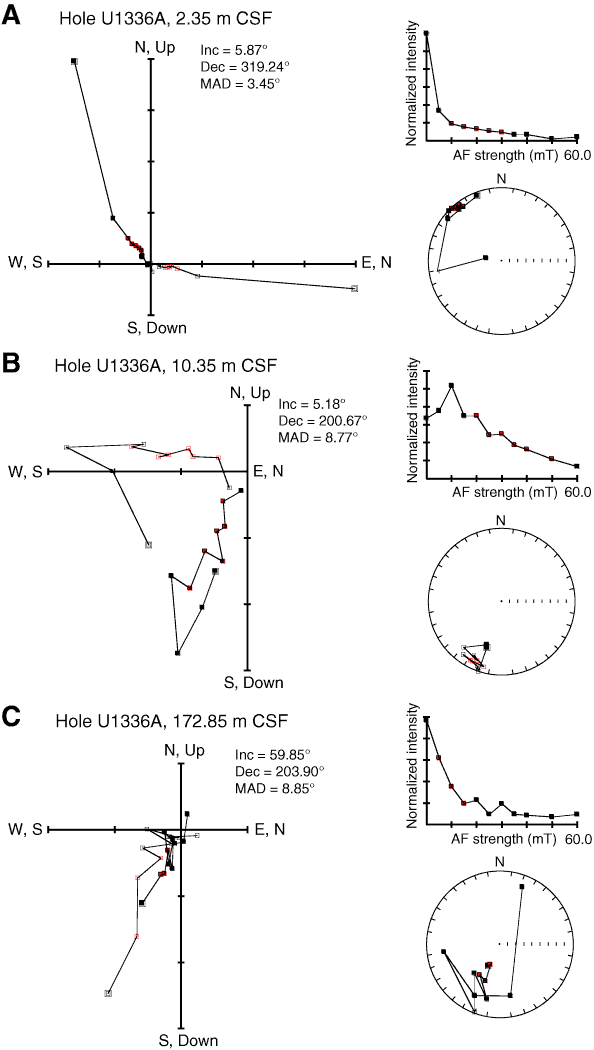
Figure F17. Alternating-field (AF) demagnetization results representative of Site U1336 discrete samples. Left plot = vector endpoints of paleomagnetic directions on vector demagnetization diagrams or modified Zijderveld plots (open squares = inclinations [Inc], solid squares = declinations [Dec]), top right plot = intensity variation with progressive demagnetization, bottom right plot = directions plotted on an equal-area stereonet. Data in A and B illustrate removal of a drilling overprint by ~10 mT, with remaining magnetization providing a relatively well-resolved characteristic remanent magnetization. C shows a sample from base of the hole, illustrating that a steep drilling overprint is dominant and a stable ChRM is not isolated during AF demagnetization. Maximum angular deviation (MAD) values provide an estimate quality of principal component analysis (PCA), where values <10 indicate good agreement between PCA vector and paleomagnetic data. See Table T14. A. Hole U1336A (2.35 m CSF). B. Hole U1336A (10.35 m CSF). C. Hole U1336A (172.85 m CSF).

Previous | Close | Next | Top of page