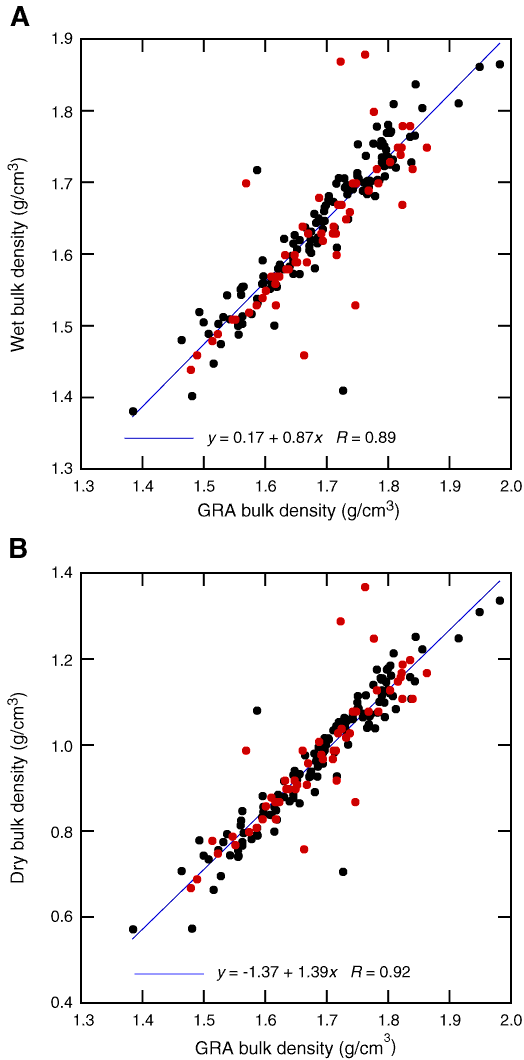
Figure F22. (A) Wet and (B) dry bulk density from MAD analysis of discrete samples from Holes U1336A (black) and U1336B (red) plotted with gamma ray attenuation (GRA) bulk density interpolated with a 20 cm wide Gaussian window.

Previous | Close | Next | Top of page