Previous | Close | Next
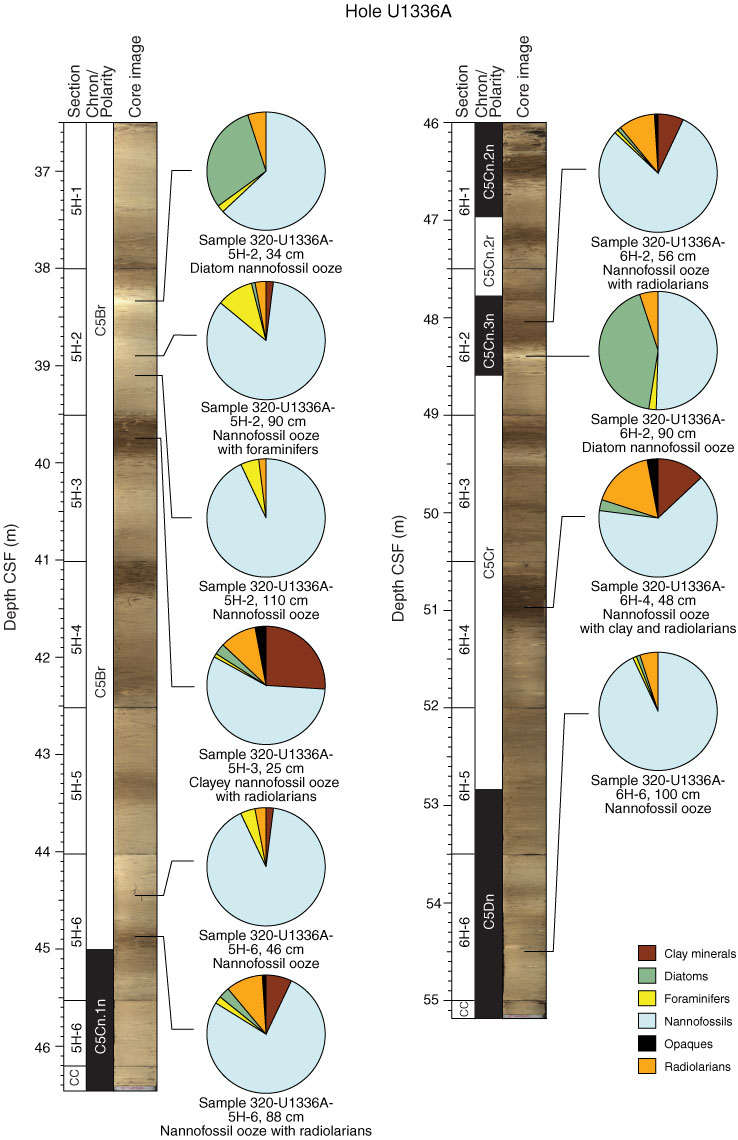
Figure F5. Light–dark sediment alternations of Miocene age including the two diatom-rich intervals. Pie charts show lithologic variability observed in smear slides.
Previous | Close | Next | Top of page