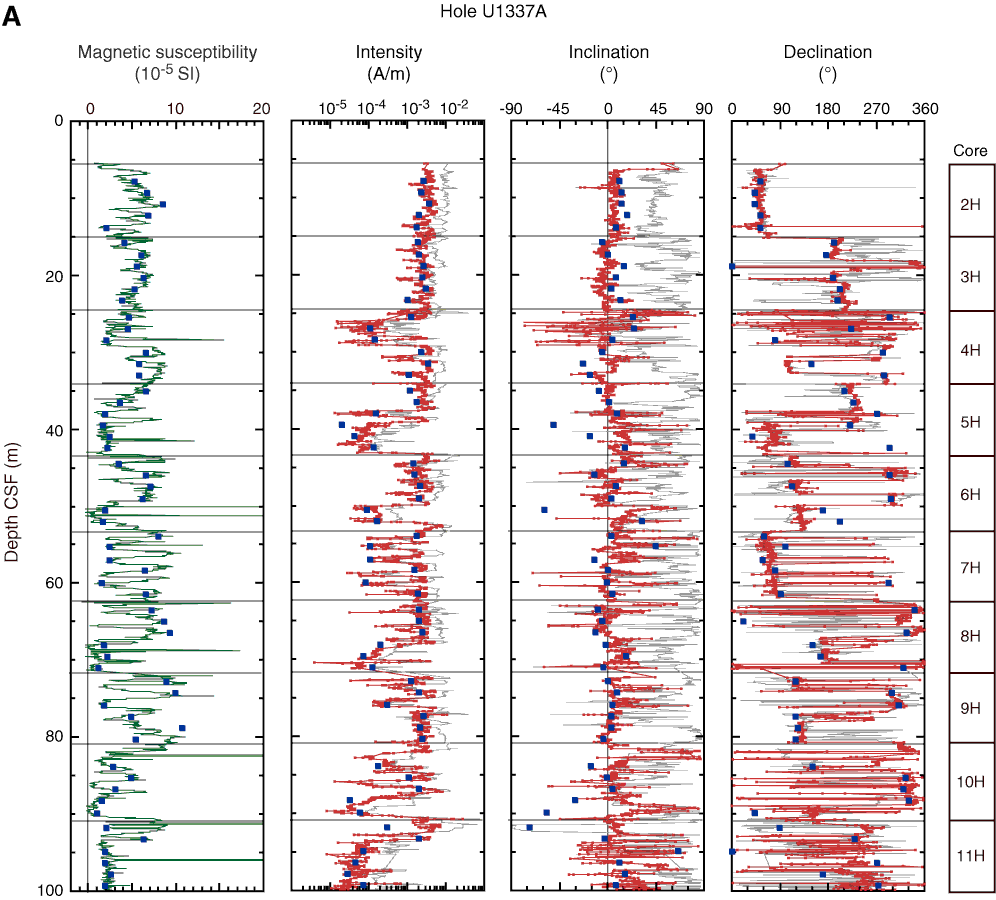
Figure F18. Magnetic susceptibility and paleomagnetic summary, Hole U1337A. Declinations are raw data before FlexIt tool orientation. Gray lines = measurements before demagnetization, red lines = measurements after 20 mT alternating-field demagnetization step, blue squares = discrete sample data. A. 0–100 m CSF. (Continued on next two pages.)
Previous | Close | Next | Top of page