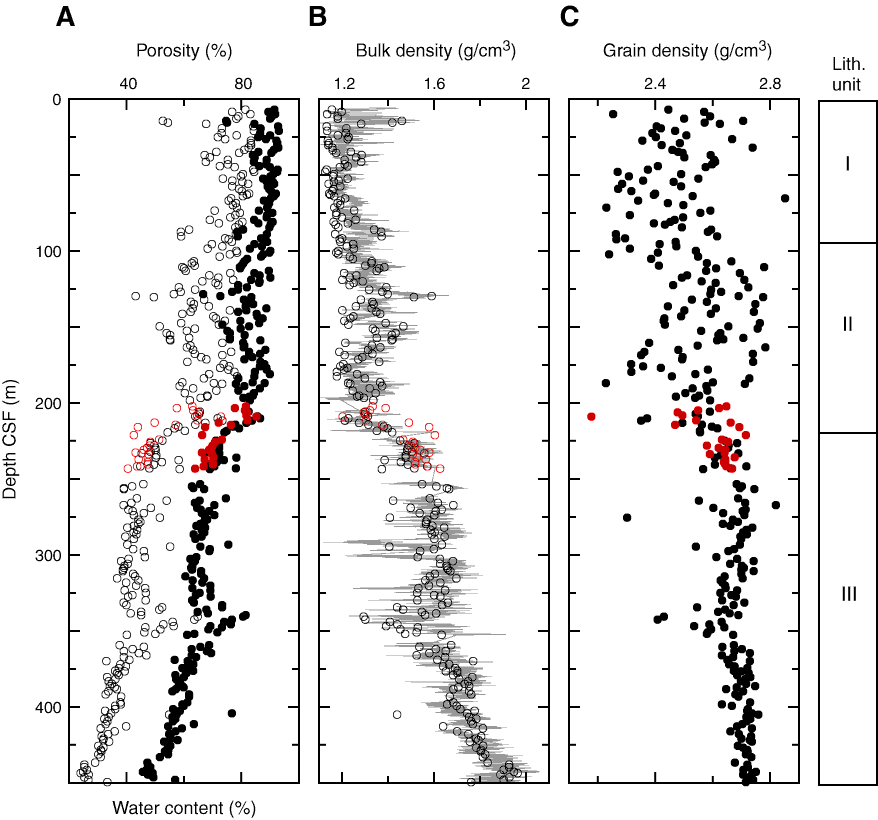
Figure F28. MAD measurements, Holes U1337A (black) and U1337B (red). Depths for Hole U1337B measurements are plotted in meters core depth below seafloor in Hole U1337A. A. Porosity (solid circles) and water content (open circles). B. Discrete sample wet bulk density and GRA bulk density (gray line). C. Grain density.

Previous | Close | Next | Top of page