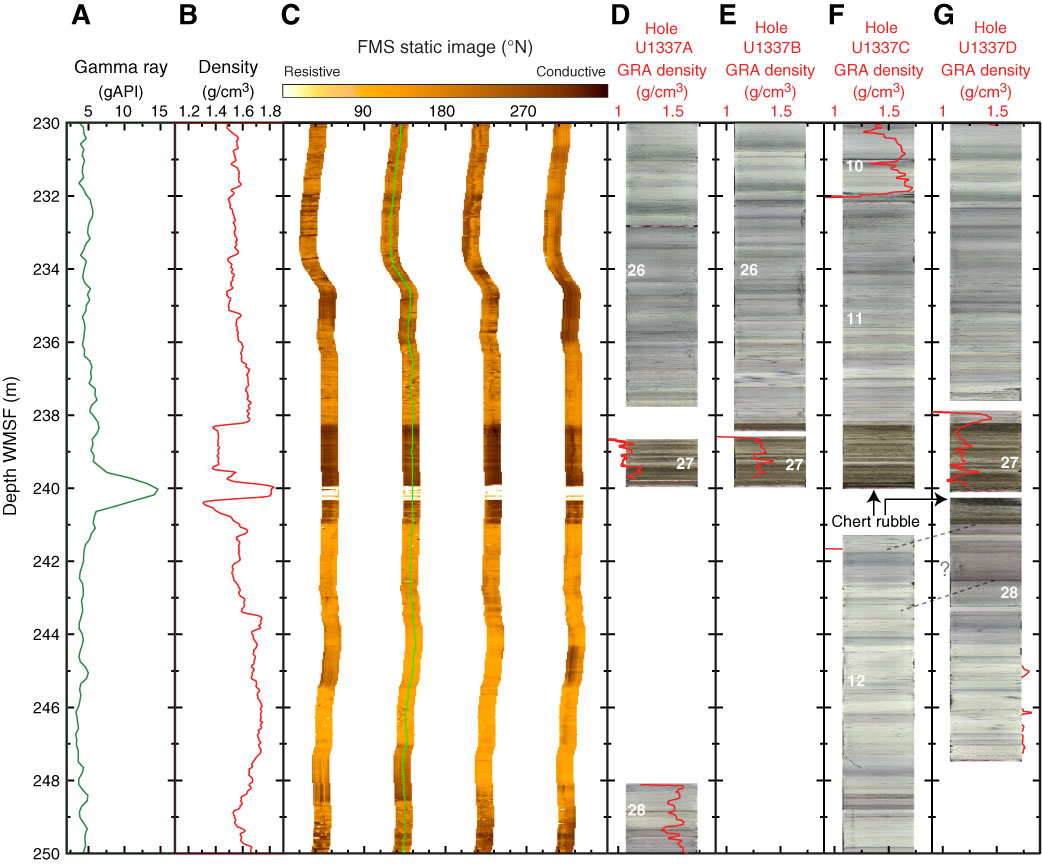
Figure F44. Downhole log curves showing (A) HNGS total gamma radiation, (B) HLDS bulk density, and (C) Formation MicroScanner (FMS) four-pad downhole resistivity image for Hole U1337A. Note the highly resistive layer (~40 cm) at 240 m WMSF. Also shown are core images and gamma ray attenuation (GRA) density for Holes (D) U1337A, (E) U1337B, (F) U1337C, and (G) U1337D. White = core numbers, gray dashed lines = another possible match for core density data.
Previous | Close | Next | Top of page