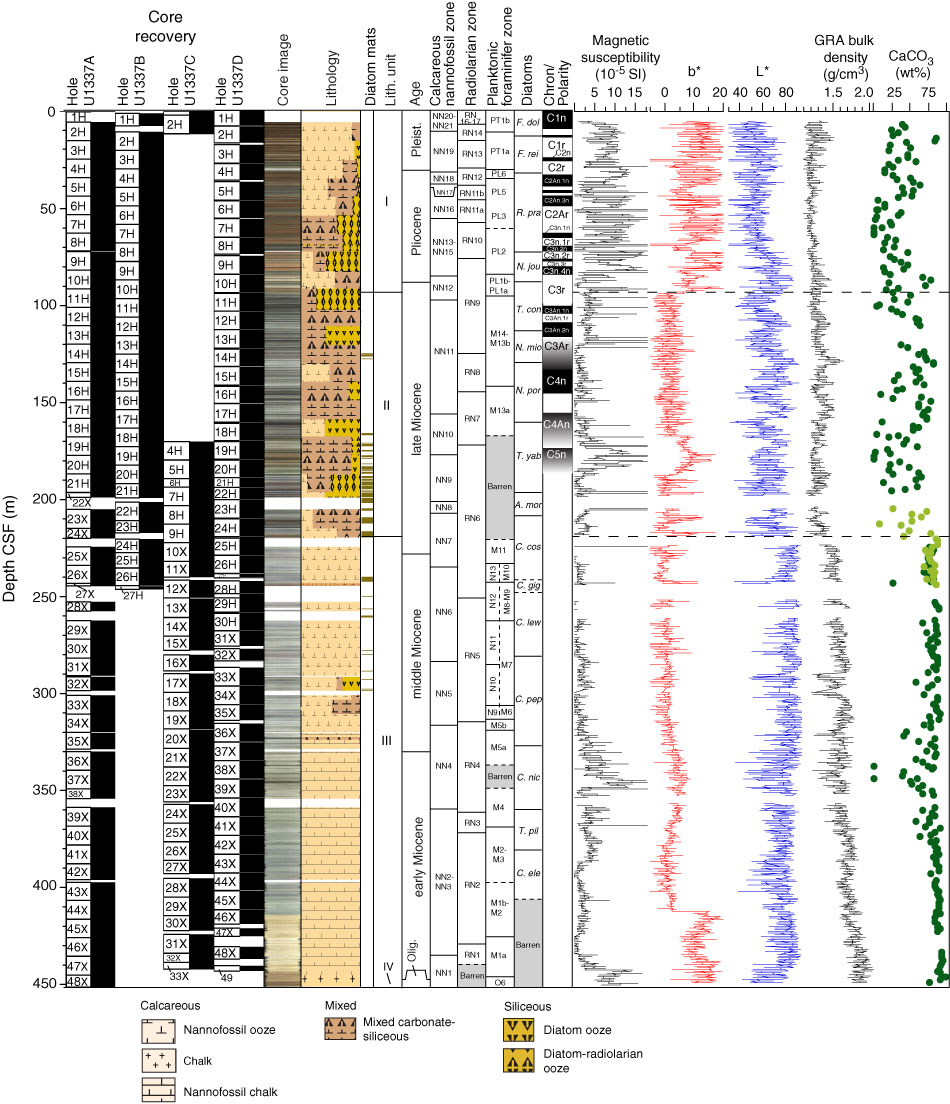
Figure F5. Lithostratigraphy summary, Site U1337. CaCO3 content: light green circles = Hole U1337B, dark green circles = Hole U1337A. Diatom mat intervals from Hole U1337D. All other measurements from Hole U1337A. Core depth below seafloor for Holes U1337D and U1337B were converted to core depth below seafloor for Hole U1337A using adjustments from Table T23. Magnetic stratigraphy represents a spliced record from all holes and is plotted relative to corrected core composite depth below seafloor. See "Biostratigraphy" for clarification of zones. L*, b* = reflectance value of sediment as defined in the LAB color model, GRA = gamma ray attenuation.
Previous | Close | Next | Top of page