Previous | Close | Next
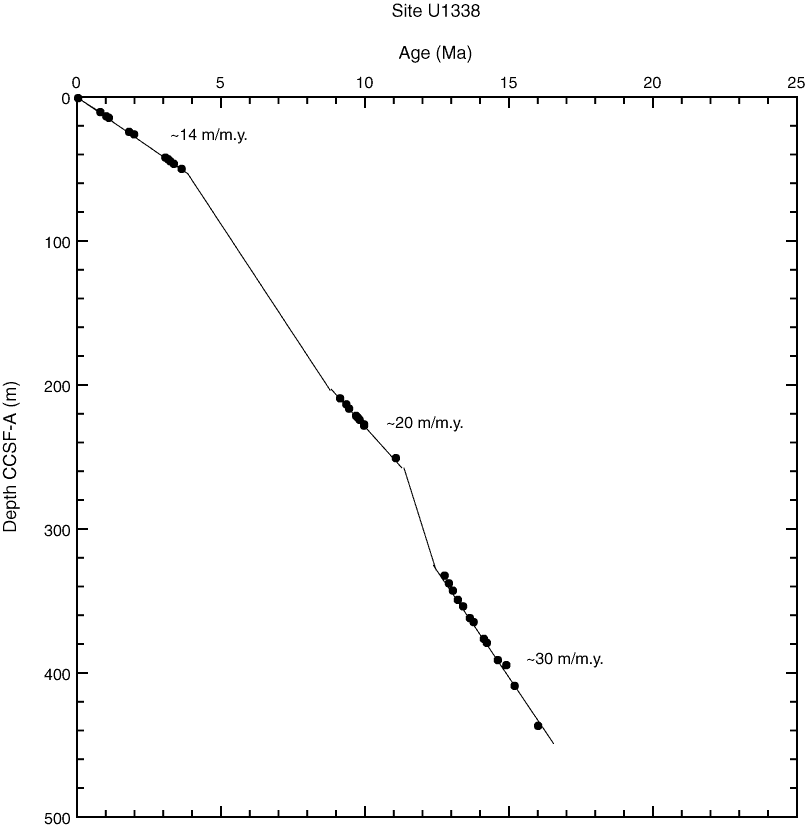
Figure F22. Depth-age plot based on polarity interpretation indicating mean sedimentation rates in the three intervals where polarity zones can be interpreted, Site U1338.
Previous | Close | Next | Top of page