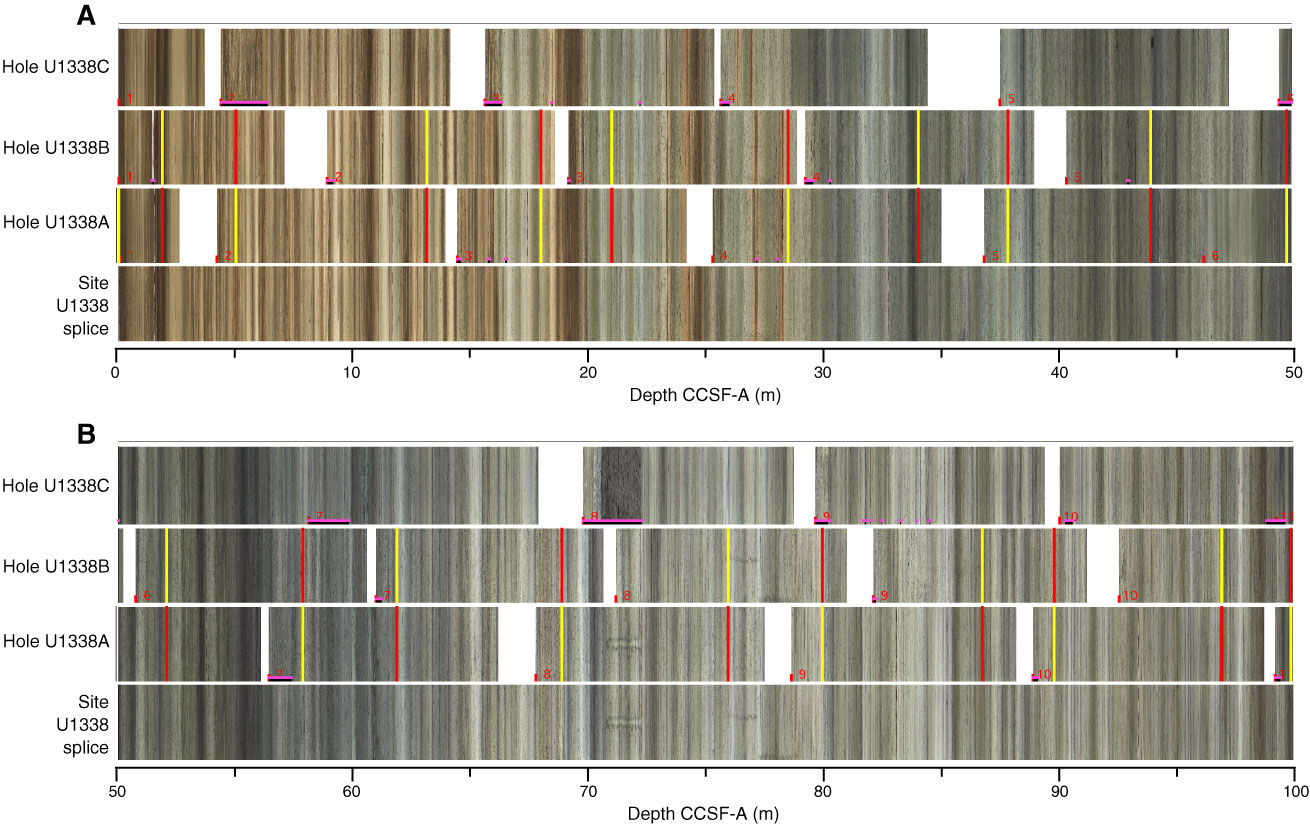
Figure F43. Core images, Holes U1338A–U1338C. Yellow lines = top of spliced interval, red lines = bottom of spliced interval, purple bars = disturbed core intervals. A. 0–50 m CCSF-A. B. 50–100 m CCSF-A. (Continued on next four pages.)
Previous | Close | Next | Top of page