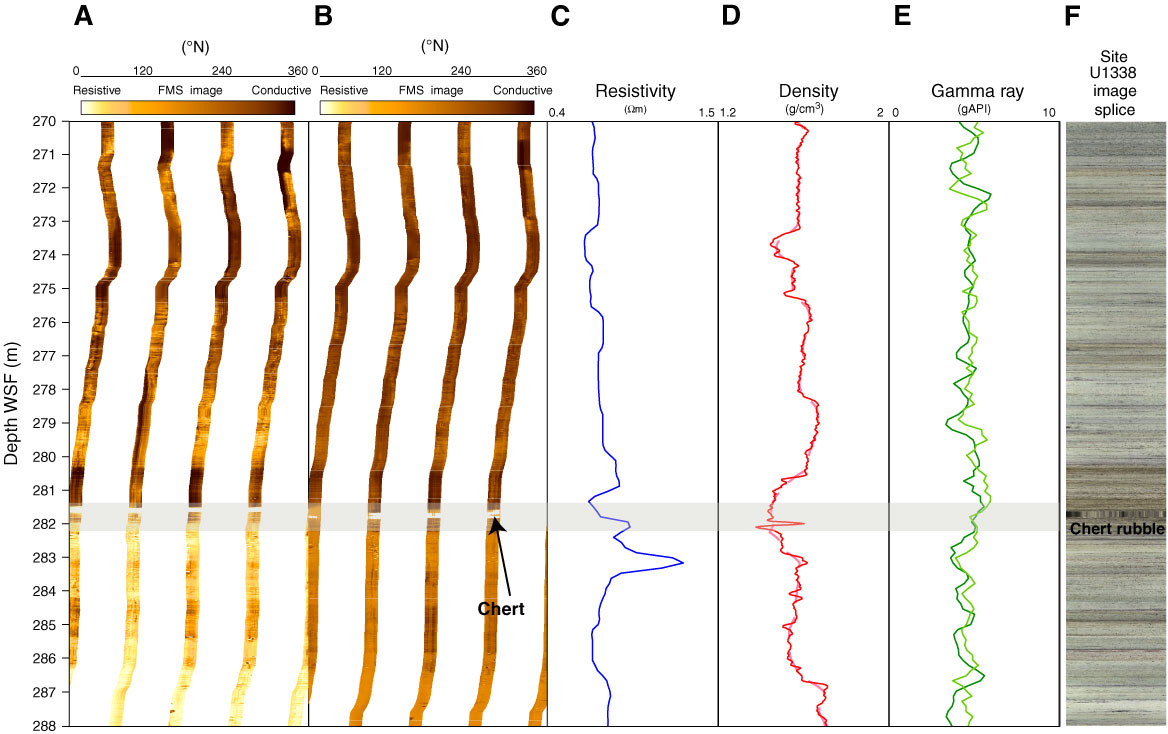
Figure F50. Downhole log curves in Hole U1338B from 270 to 288 m WSF showing Formation MicroScanner (FMS) four-pad downhole resistivity images from (A) Pass 1 and (B) Pass 2 with (C) DIT-measured SFLU resistivity, (D) HLDS-measured bulk density (red = high resolution, pink = standard resolution), (E) HNGS-measured total gamma radiation (dark green = triple combination, light green = FMS-sonic, and (F) Site U1338 spliced core images (CCSF-B depth scale).
Previous | Close | Next | Top of page