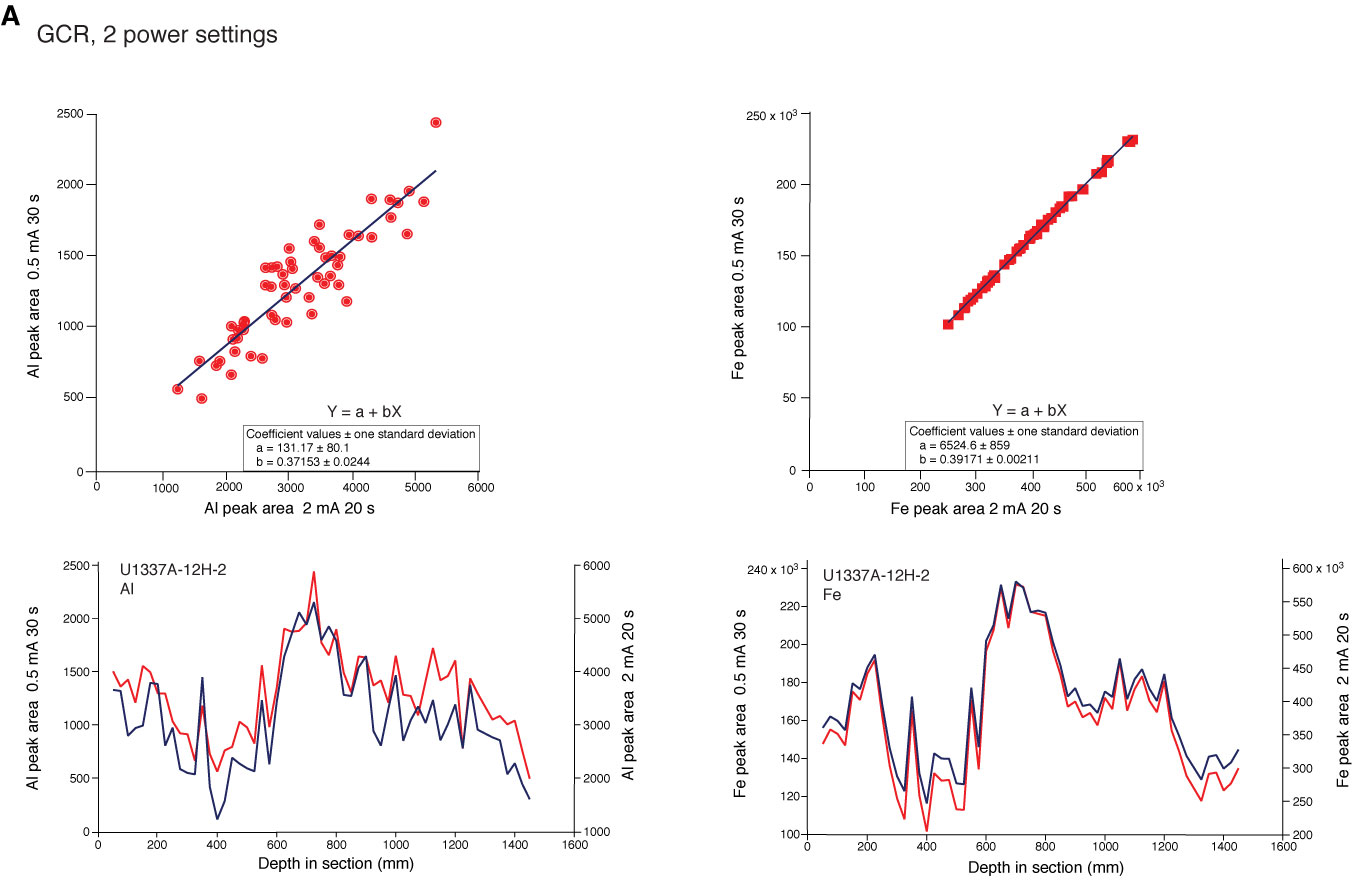
Figure F3. XRF scans run at two different tube currents to show the effect of power on peak areas and the effect of different detectors. A. Al and Fe scans at the Gulf Coast Repository (GCR) for Section 321-U1337A-12H-2 using 0.5 mA and 30 s live time (red line) vs. 2 mA and 20 s live time (blue line). Top plots in each shows a scatter plot of the individual samples. (Continued on next page.)
Previous | Close | Next | Top of page