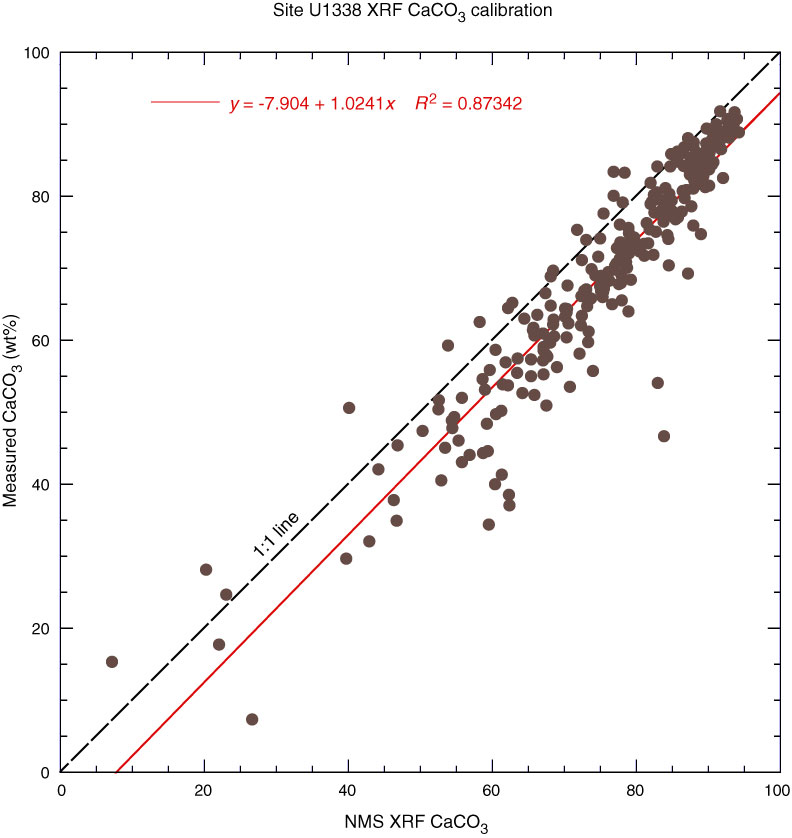
Figure F3. Normalized median-scaled (NMS) X-ray fluorescence (XRF) CaCO3 plotted against 255 discrete CaCO3 analyses from the same depth intervals at Site U1338. The red line shows the linear least-squares fit to the data, and the black dashed line represents the perfect fit.
Previous | Close | Next | Top of page