Previous | Close | Next
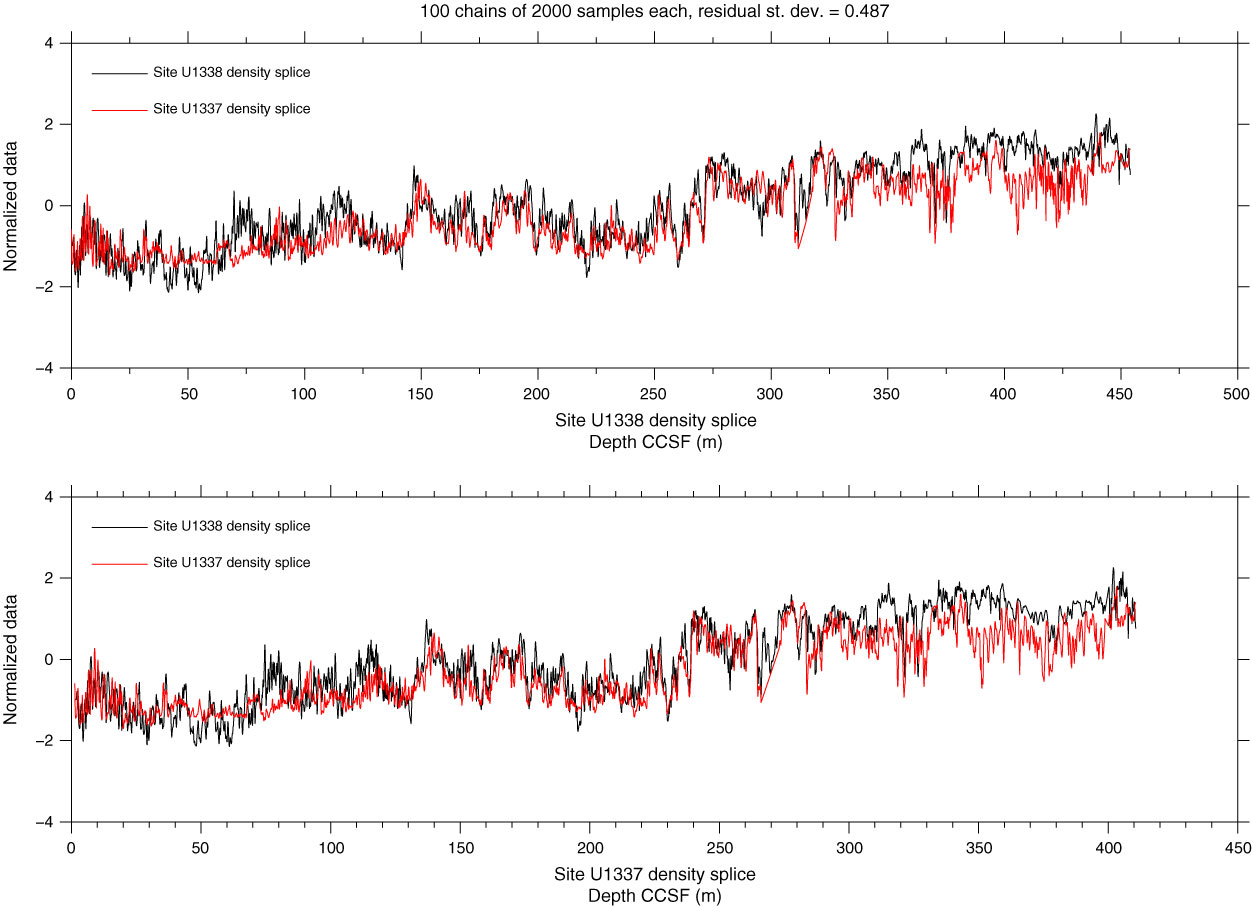
Figure F7. Results of Monte Carlo correlation of core splice records between Sites U1337 (red) and U1338 (black). The core splice data are plotted on the same depth scale (m CCSF at Site U1337 and U1338).
Previous | Close | Next | Top of page