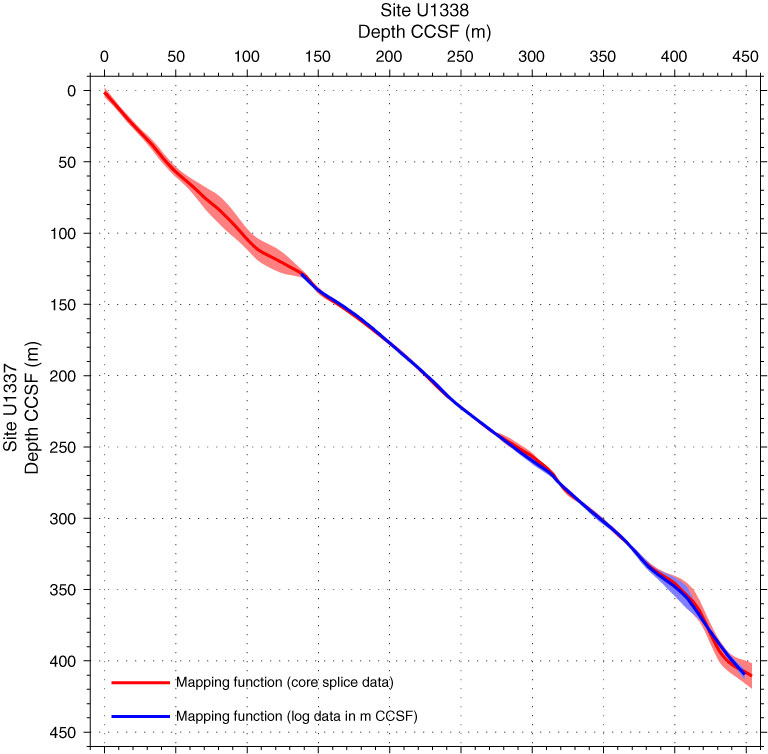
Figure F9. Mapping functions that correlate CCSF depths of core splice (red) and downhole log data (blue) between Sites U1337 and U1338. The light red and light blue regions show the uncertainty bands of the mapping functions (±1 standard deviation).
Previous | Close | Top of page