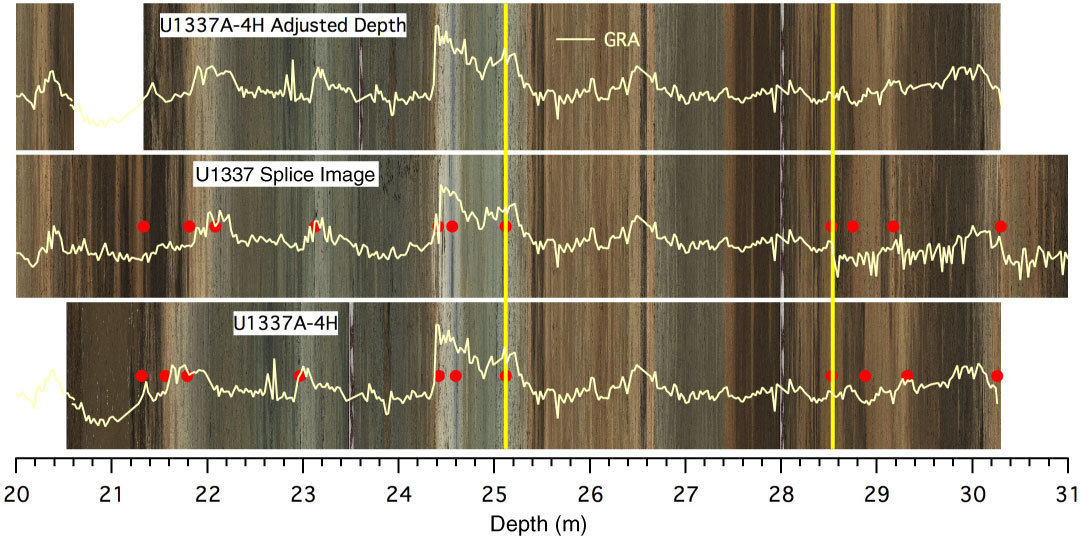
Figure F5. Example of the effects of “core stretching.” Bottom: composite image of Core 321-U1337A-4H; middle: Site U1337 spliced image; top: image of Core 321-U1337A-4H plotted against adjusted (stretched) depth scale. Red symbols are plotted at tie points used to effect the stretch. Yellow vertical lines define the limits of the portion of Core 321-U1337A-4H used in the splice. Pale yellow traces are the appropriate gamma ray attenuation (GRA) data.
Previous | Close | Top of page