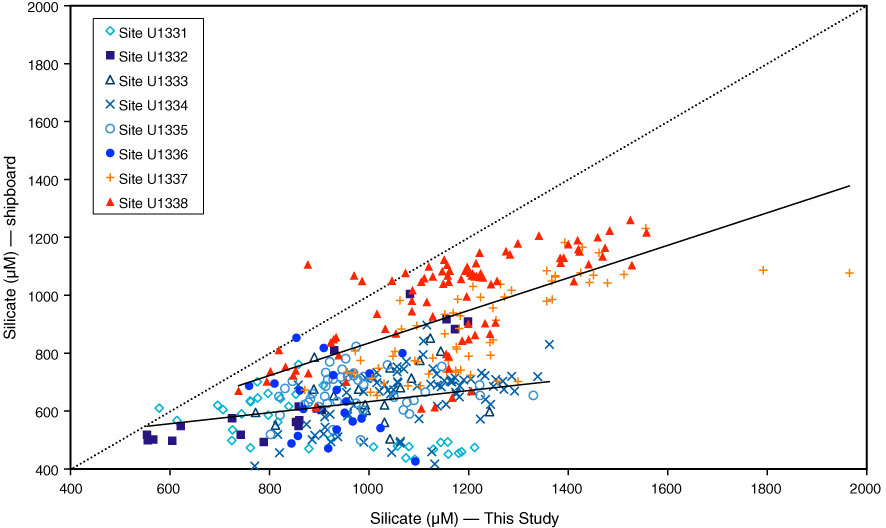
Figure F3. Comparison plot of dissolved silicate data measured during Expedition 320/321 vs. measurements made in this study. Solid lines are linear regressions for Expeditions 320 (y = 0.19x + 441; R2 = 0.07; n = 227) and 321 (y = 0.56x + 272; R2 =0.40; n = 153). Linear regression for all data is y = 0.67x + 42 (R2 = 0.41; n = 380). Dotted line is 1:1.
Previous | Close | Top of page