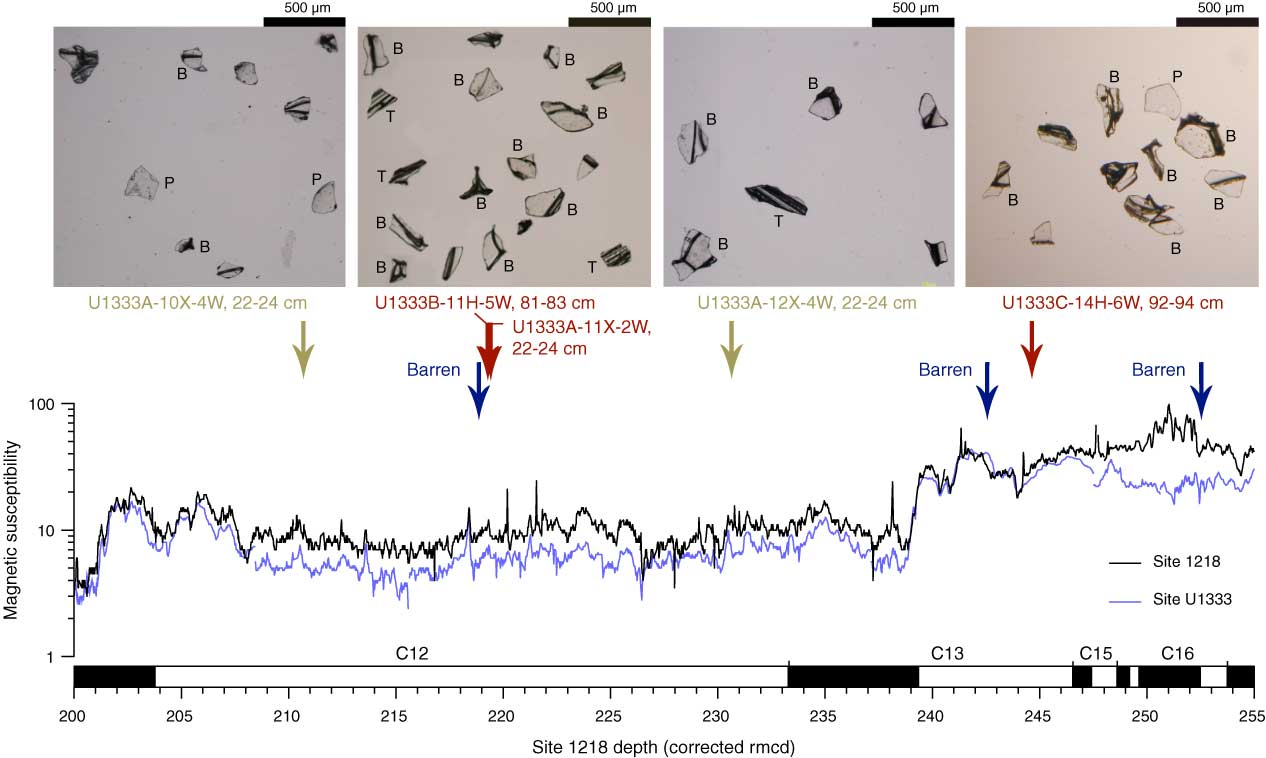
Figure F1. Single polarized photomicrographs of glass shards separated from sediment samples (upper panels) and high-resolution depth profile of magnetic susceptibility in the Eocene–Oligocene transition interval (lower panel). The depth scale of the lower panel is the corrected revised meters composite depth (rmcd) of Site 1218 (Westerhold et al., 2012). B = balloon-type, P = plate-type, T = tube-type.